Ricoh 2011 Annual Report Download - page 8
Download and view the complete annual report
Please find page 8 of the 2011 Ricoh annual report below. You can navigate through the pages in the report by either clicking on the pages listed below, or by using the keyword search tool below to find specific information within the annual report.-
 1
1 -
 2
2 -
 3
3 -
 4
4 -
 5
5 -
 6
6 -
 7
7 -
 8
8 -
 9
9 -
 10
10 -
 11
11 -
 12
12 -
 13
13 -
 14
14 -
 15
15 -
 16
16 -
 17
17 -
 18
18 -
 19
19 -
20
-
21
-
22
-
23
-
24
-
25
-
26
-
27
-
28
-
29
-
30
-
31
-
32
-
33
-
34
-
35
-
36
-
37
-
38
 |
 |

ANNUAL REPORT 20117
ANNUAL REPORT 2011
7
7
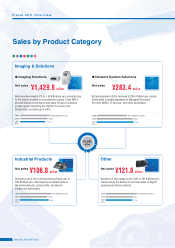
Sales by Product Category
¥1,429.8 billion
Industrial Products Other
● Imaging Solutions
Net sales
Net sales Net sales
● Network System Solutions
Net sales
Imaging & Solutions
Net sales rose 5.1% from the previous fiscal year to
106.8 billion yen, reflecting the increased sales of
the semiconductor, optical units, and electric
component businesses.
Net sales of this category fell 2.0% to 121.8 billion yen,
mainly due to the decline of overseas sales of digital
cameras and other products.
Net sales decreased 5.7% to 1,429.8 billion yen, primarily due
to the decline in sales of monochrome copiers. Color MFPs
showed steady performance and sales of color production
printers grew. Excluding the effects of currency rate
fluctuations, net sales grew 0.8%.
Net sales posted a 3.4% increase to 283.4 billion yen, mainly
attributable to global expansion of Managed Document
Services (MDS), IT services, and other businesses.
¥283.4 billion
¥1,942
billion
2011 1,429.8
2010 1,516.1
2009 1,598.6 (Billions of yen)
(FY)
2011 283.4
2010 274.0
2009 234.4 (Billions of yen)
(FY)
2011 106.8
2010 101.6
2009 115.5 (Billions of yen)
(FY)
2011 121.8
2010 124.4
2009 143.0 (Billions of yen)
(FY)
Fiscal 2011 Overview
¥106.8 billion ¥121.8 billion