RBS 2006 Annual Report Download - page 54
Download and view the complete annual report
Please find page 54 of the 2006 RBS annual report below. You can navigate through the pages in the report by either clicking on the pages listed below, or by using the keyword search tool below to find specific information within the annual report.-
 1
1 -
2
-
3
-
4
-
5
-
6
-
7
-
8
-
9
-
10
-
11
-
12
-
13
-
14
-
15
-
16
-
17
-
18
-
19
-
20
-
21
-
22
-
23
-
24
-
25
-
26
-
27
-
28
-
29
-
30
-
31
-
32
-
33
-
34
-
35
-
36
-
37
-
38
-
39
-
40
-
41
-
42
-
43
-
 44
44 -
 45
45 -
 46
46 -
 47
47 -
 48
48 -
 49
49 -
 50
50 -
 51
51 -
 52
52 -
 53
53 -
 54
54 -
 55
55 -
 56
56 -
 57
57 -
 58
58 -
 59
59 -
 60
60 -
 61
61 -
 62
62 -
 63
63 -
 64
64 -
65
-
66
-
67
-
68
-
69
-
70
-
71
-
72
-
73
-
74
-
75
-
76
-
77
-
78
-
79
-
80
-
81
-
82
-
83
-
84
-
85
-
86
-
87
-
88
-
89
-
90
-
91
-
92
-
93
-
94
-
95
-
96
-
97
-
98
-
99
-
100
-
101
-
102
-
103
-
104
-
105
-
106
-
107
-
108
-
109
-
110
-
111
-
112
-
113
-
114
-
115
-
116
-
117
-
118
-
119
-
120
-
121
-
122
-
123
-
124
-
125
-
126
-
127
-
128
-
129
-
130
-
131
-
132
-
133
-
134
-
135
-
136
-
137
-
138
-
139
-
140
-
141
-
142
-
143
-
144
-
145
-
146
-
147
-
148
-
149
-
150
-
151
-
152
-
153
-
154
-
155
-
156
-
157
-
158
-
159
-
160
-
161
-
162
-
163
-
164
-
165
-
166
-
167
-
168
-
169
-
170
-
171
-
172
-
173
-
174
-
175
-
176
-
177
-
178
-
179
-
180
-
181
-
182
-
183
-
184
-
185
-
186
-
187
-
188
-
189
-
190
-
191
-
192
-
193
-
194
-
195
-
196
-
197
-
198
-
199
-
200
-
201
-
202
-
203
-
204
-
205
-
206
-
207
-
208
-
209
-
210
-
211
-
212
-
213
-
214
-
215
-
216
-
217
-
218
-
219
-
220
-
221
-
222
-
223
-
224
-
225
-
226
-
227
-
228
-
229
-
230
-
231
-
232
-
233
-
234
-
235
-
236
-
237
-
238
-
239
-
240
-
241
-
242
-
243
-
244
-
245
-
246
-
247
-
248
-
249
-
250
-
251
-
252
-
253
-
254
-
255
-
256
-
257
-
258
-
259
-
260
-
261
-
262
 |
 |

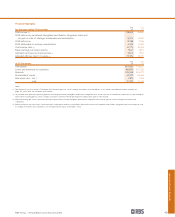
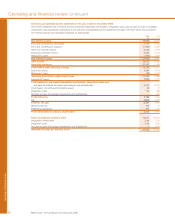
53
RBS Group • Annual Report and Accounts 2006
Operating and financial review
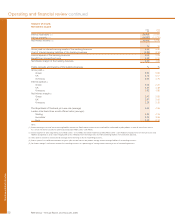
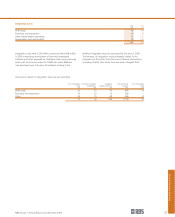
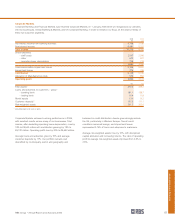
Average balance sheet and related interest
2006 2005
Average Average
balance Interest Rate balance Interest Rate
£m £m % £m £m %
Assets
Treasury bills and other eligible bills – UK 2,059 90 4.37 3,160 138 4.37
– Overseas 70 3 4.29 63 2 3.17
Loans and advances to banks – UK 15,850 697 4.40 15,338 649 4.23
– Overseas 7,440 282 3.79 9,465 308 3.25
Loans and advances to customers – UK 239,469 15,204 6.35 212,991 13,510 6.34
– Overseas 121,093 6,977 5.76 104,594 5,207 4.98
Debt securities – UK 13,143 662 5.04 15,553 697 4.48
– Overseas 22,012 1,051 4.77 22,526 994 4.41
Total interest-earning assets – banking business (2,3) 421,136 24,966 5.93 383,690 21,505 5.60
– trading business (4) 202,408 172,990
Total interest-earning assets 623,544 556,680
Non-interest-earning assets (2,3)210,358 180,368
Total assets 833,902 737,048
Percentage of assets applicable to overseas operations 35.2% 35.3%
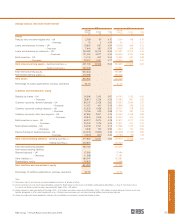
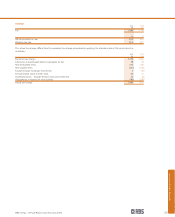
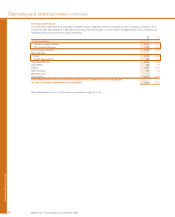
Liabilities and shareholders’ equity
Deposits by banks – UK 35,998 1,393 3.87 34,742 1,192 3.43
– Overseas 28,813 1,228 4.26 27,383 891 3.25
Customer accounts: demand deposits – UK 86,207 2,428 2.82 73,653 2,056 2.79
– Overseas 13,127 441 3.36 13,858 299 2.16
Customer accounts: savings deposits – UK 30,933 1,058 3.42 26,727 778 2.91
– Overseas 19,766 529 2.68 21,700 381 1.76
Customer accounts: other time deposits – UK 67,806 2,807 4.14 60,454 2,328 3.85
– Overseas 36,839 1,636 4.44 32,024 979 3.06
Debt securities in issue – UK 55,912 2,670 4.78 52,672 2,071 3.93
– Overseas 25,249 1,076 4.26 19,621 633 3.23
Subordinated liabilities – UK 24,008 1,231 5.13 23,948 1,122 4.69
– Overseas 2,639 160 6.06 2,642 154 5.83
Internal funding of trading business – UK (44,475) (1,893) 4.26 (37,628) (1,125) 2.99
– Overseas (4,930) (207) 4.20 (2,186) (39) 1.78
Total interest-bearing liabilities – banking business (2,3) 377,892 14,557 3.85 349,610 11,720 3.35
– trading business (4) 204,810 172,744
Total interest-bearing liabilities 582,702 522,354
Non-interest-bearing liabilities
Demand deposits – UK 17,909 17,484
– Overseas 11,668 11,181
Other liabilities (3,4) 184,747 153,081
Shareholders’ equity 36,876 32,948
Total liabilities and shareholders’ equity 833,902 737,048
Percentage of liabilities applicable to overseas operations 32.3% 33.5%
Notes:
(1) The analysis into UK and Overseas has been compiled on the basis of location of office.
(2) Interest-earning assets and interest-bearing liabilities exclude the Retail bancassurance assets and liabilities attributable to policyholders, in view of their distinct nature.
As a result, net interest income has been adjusted by £63 million (2005 – £59 million).
(3) Interest income has been adjusted by £215 million (2005 – £115 million) and interest expense by £465 million (2005 – £307 million) to record interest on financial assets and
liabilities designated as at fair value through profit or loss. Related interest-earning assets and interest-bearing liabilities have also been adjusted.
(4) Interest receivable and interest payable on trading assets and liabilities are included in income from trading activities.