RBS 2006 Annual Report Download - page 194
Download and view the complete annual report
Please find page 194 of the 2006 RBS annual report below. You can navigate through the pages in the report by either clicking on the pages listed below, or by using the keyword search tool below to find specific information within the annual report.-
 1
1 -
2
-
3
-
4
-
5
-
6
-
7
-
8
-
9
-
10
-
11
-
12
-
13
-
14
-
15
-
16
-
17
-
18
-
19
-
20
-
21
-
22
-
23
-
24
-
25
-
26
-
27
-
28
-
29
-
30
-
31
-
32
-
33
-
34
-
35
-
36
-
37
-
38
-
39
-
40
-
41
-
42
-
43
-
44
-
45
-
46
-
47
-
48
-
49
-
50
-
51
-
52
-
53
-
54
-
55
-
56
-
57
-
58
-
59
-
60
-
61
-
62
-
63
-
64
-
65
-
66
-
67
-
68
-
69
-
70
-
71
-
72
-
73
-
74
-
75
-
76
-
77
-
78
-
79
-
80
-
81
-
82
-
83
-
84
-
85
-
86
-
87
-
88
-
89
-
90
-
91
-
92
-
93
-
94
-
95
-
96
-
97
-
98
-
99
-
100
-
101
-
102
-
103
-
104
-
105
-
106
-
107
-
108
-
109
-
110
-
111
-
112
-
113
-
114
-
115
-
116
-
117
-
118
-
119
-
120
-
121
-
122
-
123
-
124
-
125
-
126
-
127
-
128
-
129
-
130
-
131
-
132
-
133
-
134
-
135
-
136
-
137
-
138
-
139
-
140
-
141
-
142
-
143
-
144
-
145
-
146
-
147
-
148
-
149
-
150
-
151
-
152
-
153
-
154
-
155
-
156
-
157
-
158
-
159
-
160
-
161
-
162
-
163
-
164
-
165
-
166
-
167
-
168
-
169
-
170
-
171
-
172
-
173
-
174
-
175
-
176
-
177
-
178
-
179
-
180
-
181
-
182
-
183
-
 184
184 -
 185
185 -
 186
186 -
 187
187 -
 188
188 -
 189
189 -
 190
190 -
 191
191 -
 192
192 -
 193
193 -
 194
194 -
 195
195 -
 196
196 -
 197
197 -
 198
198 -
 199
199 -
 200
200 -
 201
201 -
 202
202 -
 203
203 -
 204
204 -
205
-
206
-
207
-
208
-
209
-
210
-
211
-
212
-
213
-
214
-
215
-
216
-
217
-
218
-
219
-
220
-
221
-
222
-
223
-
224
-
225
-
226
-
227
-
228
-
229
-
230
-
231
-
232
-
233
-
234
-
235
-
236
-
237
-
238
-
239
-
240
-
241
-
242
-
243
-
244
-
245
-
246
-
247
-
248
-
249
-
250
-
251
-
252
-
253
-
254
-
255
-
256
-
257
-
258
-
259
-
260
-
261
-
262
 |
 |

RBS Group • Annual Report and Accounts 2006 193
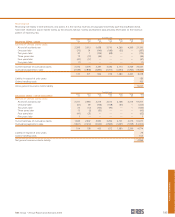
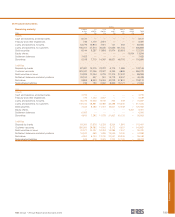
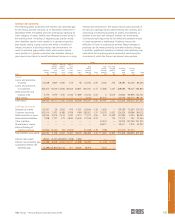
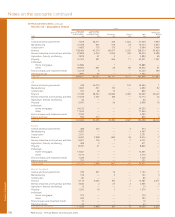
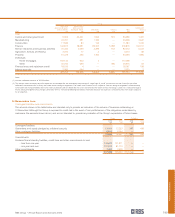
Financial statements
Company
After 3 After 6 After 1
months months year Total Non
but less but less but less interest interest Banking
3 months than than than Over 5 earning/ earning/ Book
or less 6 months 1 year 5 years years bearing Yield bearing Total
2006 £m £m £m £m £m £m % £m £m
Assets
Loans and advances to banks 1,378 178 — 1,457 4,235 7,248 6.33 4 7,252
Loans and advances to customers 286 ————2865.94 — 286
Investment in subsidiaries ———————21,784 21,784
Other assets ——————— 3 3
Total assets 1,664 178 — 1,457 4,235 7,534 6.32 21,791 29,325
Liabilities and equity
Deposits by banks 738 ————7385.42 — 738
Debt securities in issue 2,139 ————2,139 5.24 — 2,139
Other liabilities ———————5757
Subordinated liabilities 1,233 178 — 1,455 5,328 8,194 6.24 — 8,194
Shareholders’ equity ———————18,197 18,197
Total liabilities and equity 4,110 178 — 1,455 5,328 11,071 5.99 18,254 29,325
Interest rate swaps —————— —
Interest rate sensitivity gap (2,446) — — 2 (1,093) (3,537) 3,537
Cumulative interest rate sensitivity gap (2,446) (2,446) (2,446) (2,444) (3,537) (3,537) —
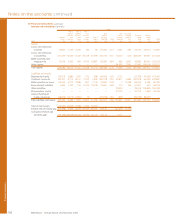
2005
Assets
Loans and advances to banks 1,803 554 119 1,585 5,061 9,122 6.05 — 9,122
Loans and advances to customers 305 — — 262 — 567 2.82 — 567
Investment in subsidiaries ———————20,851 20,851
Other assets ———————202202
Total assets 2,108 554 119 1,847 5,061 9,689 5.86 21,053 30,742
Liabilities and equity
Deposits by banks 951————9514.42 — 951
Customer accounts 55————55——55
Debt securities in issue 2,942 ————2,942 4.55 — 2,942
Other liabilities ———————1414
Subordinated liabilities 1,317 567 116 1,603 5,639 9,242 6.83 — 9,242
Shareholders’ equity ———————17,538 17,538
Total liabilities and equity 5,265 567 116 1,603 5,639 13,190 6.12 17,552 30,742
Interest rate swaps —————— —
Interest rate sensitivity gap (3,157) (13) 3 244 (578) (3,501) 3,501
Cumulative interest rate sensitivity gap (3,157) (3,170) (3,167) (2,923) (3,501) (3,501) —
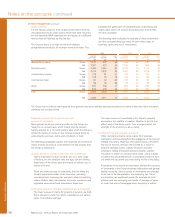
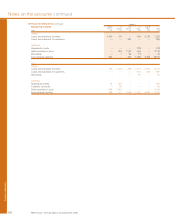
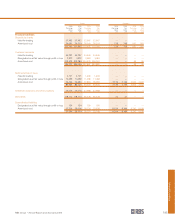
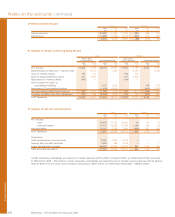
Trading book
The table below sets out by time band the net effect on the Group’s profit or loss of a basis point (0.01%) increase in interest rates,
assuming all trading positions remained unchanged.
Group
After 3 After 6 After 1
months months year
but less but less but less
3 months than than than Over 5
or less 6 months 1 year 5 years years Total
2006 £000 £000 £000 £000 £000 £000
Gain/(loss) per basis point increase 187 102 110 (2,033) 763 (871)
2005
(Loss)/gain per basis point increase (487) (40) 180 (1,631) 1,146 (832)
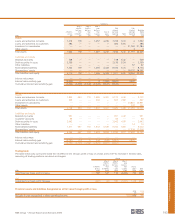
Financial assets and liabilities designated as at fair value through profit or loss
2006 2005
£m £m
Net gain in year recognised in other operating income 573 364