RBS 2006 Annual Report Download - page 189
Download and view the complete annual report
Please find page 189 of the 2006 RBS annual report below. You can navigate through the pages in the report by either clicking on the pages listed below, or by using the keyword search tool below to find specific information within the annual report.-
 1
1 -
2
-
3
-
4
-
5
-
6
-
7
-
8
-
9
-
10
-
11
-
12
-
13
-
14
-
15
-
16
-
17
-
18
-
19
-
20
-
21
-
22
-
23
-
24
-
25
-
26
-
27
-
28
-
29
-
30
-
31
-
32
-
33
-
34
-
35
-
36
-
37
-
38
-
39
-
40
-
41
-
42
-
43
-
44
-
45
-
46
-
47
-
48
-
49
-
50
-
51
-
52
-
53
-
54
-
55
-
56
-
57
-
58
-
59
-
60
-
61
-
62
-
63
-
64
-
65
-
66
-
67
-
68
-
69
-
70
-
71
-
72
-
73
-
74
-
75
-
76
-
77
-
78
-
79
-
80
-
81
-
82
-
83
-
84
-
85
-
86
-
87
-
88
-
89
-
90
-
91
-
92
-
93
-
94
-
95
-
96
-
97
-
98
-
99
-
100
-
101
-
102
-
103
-
104
-
105
-
106
-
107
-
108
-
109
-
110
-
111
-
112
-
113
-
114
-
115
-
116
-
117
-
118
-
119
-
120
-
121
-
122
-
123
-
124
-
125
-
126
-
127
-
128
-
129
-
130
-
131
-
132
-
133
-
134
-
135
-
136
-
137
-
138
-
139
-
140
-
141
-
142
-
143
-
144
-
145
-
146
-
147
-
148
-
149
-
150
-
151
-
152
-
153
-
154
-
155
-
156
-
157
-
158
-
159
-
160
-
161
-
162
-
163
-
164
-
165
-
166
-
167
-
168
-
169
-
170
-
171
-
172
-
173
-
174
-
175
-
176
-
177
-
178
-
 179
179 -
 180
180 -
 181
181 -
 182
182 -
 183
183 -
 184
184 -
 185
185 -
 186
186 -
 187
187 -
 188
188 -
 189
189 -
 190
190 -
 191
191 -
 192
192 -
 193
193 -
 194
194 -
 195
195 -
 196
196 -
 197
197 -
 198
198 -
 199
199 -
200
-
201
-
202
-
203
-
204
-
205
-
206
-
207
-
208
-
209
-
210
-
211
-
212
-
213
-
214
-
215
-
216
-
217
-
218
-
219
-
220
-
221
-
222
-
223
-
224
-
225
-
226
-
227
-
228
-
229
-
230
-
231
-
232
-
233
-
234
-
235
-
236
-
237
-
238
-
239
-
240
-
241
-
242
-
243
-
244
-
245
-
246
-
247
-
248
-
249
-
250
-
251
-
252
-
253
-
254
-
255
-
256
-
257
-
258
-
259
-
260
-
261
-
262
 |
 |

Financial statements
RBS Group • Annual Report and Accounts 2006
188
Notes on the accounts continued
Frequency and severity of claims – for contracts where death
is the insured risk, the most significant factors that could
increase the overall frequency of claims are epidemics or
widespread changes in lifestyle, resulting in earlier or more
claims than expected.
For contracts where survival is the insured risk, the most
significant factor is continued improvement in medical science
and social conditions that would increase longevity.
For contracts with fixed and guaranteed benefits and fixed
future premiums, there are no mitigating terms and conditions
that reduce the insurance risk accepted. Participating
contracts can result in a significant portion of the insurance
risk being shared with the insured party.
Sources of uncertainty in the estimation of future benefit
payments and premium receipts – the Group uses base tables
of standard mortality appropriate to the type of contract being
written and the territory in which the insured person resides.
These are adjusted to reflect the Group’s experience, mortality
improvements and voluntary termination behaviour.
Limitations of sensitivity analysis: the above tables demonstrate
the effect of a change in a key assumption whilst other
assumptions remain unaffected. In reality, such an occurrence
is unlikely, due to correlation between the assumptions and
other factors. It should also be noted that these sensitivities are
non-linear, and larger or smaller impacts should not be
interpolated or extrapolated from these results. The sensitivity
analyses do not take into consideration that assets and
liabilities are actively managed and may vary at the time that
any actual market movement occurs.
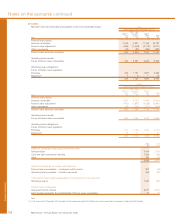
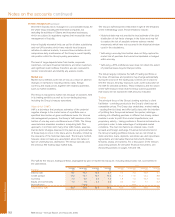
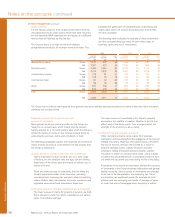
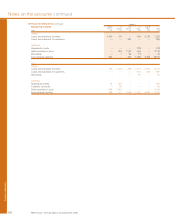
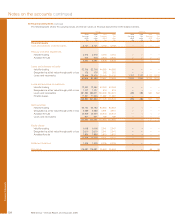
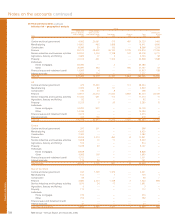
Sensitivity factor Description of sensitivity factor applied
Interest rate and investment return Change in market interest rates of ±1%.
The test allows consistently for similar changes to investment returns and
movements in the market value of backing fixed interest securities.
Expenses Increase in maintenance expenses of 10%
Assurance mortality/morbidity Increase in mortality/morbidity rates for assurance contracts of 5%
Annuitant mortality Reduction in mortality rates for annuity contracts of 5%
The above sensitivity factors are applied via actuarial and statistical models, with the following impact on the financial statements.
Impact on profit and equity
2006 2005
Risk factor Variability £m £m
Interest rates +1% (19) (16)
Interest rates –1% 23 20
Expenses +10% (5) (5)
Assurance mortality/morbidity +5% (6) (7)
Annuitant mortality –5% — —
34 Risk management (continued)