RBS 2006 Annual Report Download - page 143
Download and view the complete annual report
Please find page 143 of the 2006 RBS annual report below. You can navigate through the pages in the report by either clicking on the pages listed below, or by using the keyword search tool below to find specific information within the annual report.-
 1
1 -
2
-
3
-
4
-
5
-
6
-
7
-
8
-
9
-
10
-
11
-
12
-
13
-
14
-
15
-
16
-
17
-
18
-
19
-
20
-
21
-
22
-
23
-
24
-
25
-
26
-
27
-
28
-
29
-
30
-
31
-
32
-
33
-
34
-
35
-
36
-
37
-
38
-
39
-
40
-
41
-
42
-
43
-
44
-
45
-
46
-
47
-
48
-
49
-
50
-
51
-
52
-
53
-
54
-
55
-
56
-
57
-
58
-
59
-
60
-
61
-
62
-
63
-
64
-
65
-
66
-
67
-
68
-
69
-
70
-
71
-
72
-
73
-
74
-
75
-
76
-
77
-
78
-
79
-
80
-
81
-
82
-
83
-
84
-
85
-
86
-
87
-
88
-
89
-
90
-
91
-
92
-
93
-
94
-
95
-
96
-
97
-
98
-
99
-
100
-
101
-
102
-
103
-
104
-
105
-
106
-
107
-
108
-
109
-
110
-
111
-
112
-
113
-
114
-
115
-
116
-
117
-
118
-
119
-
120
-
121
-
122
-
123
-
124
-
125
-
126
-
127
-
128
-
129
-
130
-
131
-
132
-
 133
133 -
 134
134 -
 135
135 -
 136
136 -
 137
137 -
 138
138 -
 139
139 -
 140
140 -
 141
141 -
 142
142 -
 143
143 -
 144
144 -
 145
145 -
 146
146 -
 147
147 -
 148
148 -
 149
149 -
 150
150 -
 151
151 -
 152
152 -
 153
153 -
154
-
155
-
156
-
157
-
158
-
159
-
160
-
161
-
162
-
163
-
164
-
165
-
166
-
167
-
168
-
169
-
170
-
171
-
172
-
173
-
174
-
175
-
176
-
177
-
178
-
179
-
180
-
181
-
182
-
183
-
184
-
185
-
186
-
187
-
188
-
189
-
190
-
191
-
192
-
193
-
194
-
195
-
196
-
197
-
198
-
199
-
200
-
201
-
202
-
203
-
204
-
205
-
206
-
207
-
208
-
209
-
210
-
211
-
212
-
213
-
214
-
215
-
216
-
217
-
218
-
219
-
220
-
221
-
222
-
223
-
224
-
225
-
226
-
227
-
228
-
229
-
230
-
231
-
232
-
233
-
234
-
235
-
236
-
237
-
238
-
239
-
240
-
241
-
242
-
243
-
244
-
245
-
246
-
247
-
248
-
249
-
250
-
251
-
252
-
253
-
254
-
255
-
256
-
257
-
258
-
259
-
260
-
261
-
262
 |
 |

RBS Group • Annual Report and Accounts 2006
142
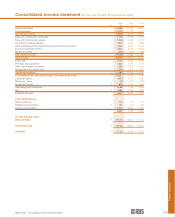
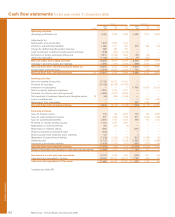
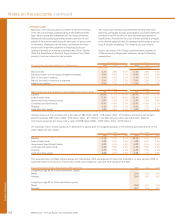
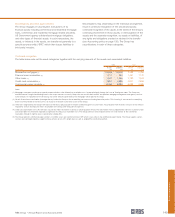
Cash flow statements for the year ended 31 December 2006
Financial statements
Group Company
2006 2005* 2004* 2006 2005* 2004
Note £m £m £m £m £m £m
Operating activities
Operating profit before tax 9,186 7,936 7,284 3,486 1,932 2,890
Adjustments for:
Depreciation and amortisation 1,678 1,825 1,674 ———
Interest on subordinated liabilities 1,386 1,271 681 520 583 318
Charge for defined benefit pension schemes 580 462 397 ———
Cash contribution to defined benefit pension schemes (536) (452) (1,146) ———
Elimination of foreign exchange differences 4,516 (3,060) 1,864 (22) (30) —
Other non-cash items (1,120) (1,412) (25) 18 (104) 1
Net cash inflow from trading activities 15,690 6,570 10,729 4,002 2,381 3,209
Changes in operating assets and liabilities 3,980 (519) (4,264) (508) 2,050 (148)
Net cash flows from operating activities before tax 19,670 6,051 6,465 3,494 4,431 3,061
Income taxes (paid)/received (2,229) (1,911) (1,366) 154 (18) 36
Net cash flows from operating activities 37 17,441 4,140 5,099 3,648 4,413 3,097
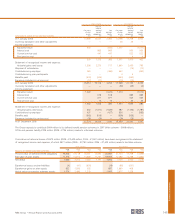
Investing activities
Sale and maturity of securities 27,126 39,472 43,022 ———
Purchase of securities (19,126) (39,196) (41,790) ———
Investment in subsidiaries — ——(1,097) (2,961) (6,342)
Sale of property, plant and equipment 2,990 2,220 1,921 ———
Purchase of property, plant and equipment (4,282) (4,812) (4,583) ———
Net investment in business interests and intangible assets 38 (63) (296) (7,968) ———
Loans to subsidiaries — ———(337) (350)
Repayments from subsidiaries — ——547 1,183 40
Net cash flows from investing activities 6,645 (2,612) (9,398) (550) (2,115) (6,652)
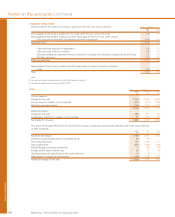
Financing activities
Issue of ordinary shares 104 163 2,845 104 163 2,845
Issue of equity preference shares 671 1,649 1,358 671 1,649 1,358
Issue of subordinated liabilities 3,027 1,234 4,624 399 337 1,424
Proceeds of minority interests issued 1,354 1,264 1,260 ———
Redemption of minority interests (81) (121) (2) ———
Repurchase of ordinary shares (991) ——(991) ——
Shares purchased by employee trusts (254) —————
Shares issued under employee share schemes 108 —— 7——
Repayment of subordinated liabilities (1,318) (1,553) (718) (547) (1,183) (40)
Dividends paid (2,727) (2,007) (1,635) (2,661) (1,912) (1,488)
Interest on subordinated liabilities (1,409) (1,332) (613) (497) (577) (318)
Net cash flows from financing activities (1,516) (703) 7,119 (3,515) (1,523) 3,781
Effects of exchange rate changes on cash and cash equivalents (3,468) 1,703 (920) (52) 42 —
Net increase in cash and cash equivalents 19,102 2,528 1,900 (469) 817 226
Cash and cash equivalents 1 January 52,549 50,021 48,121 1,126 309 83
Cash and cash equivalents 31 December 71,651 52,549 50,021 657 1,126 309
*restated (see Note 48).