RBS 2006 Annual Report Download - page 224
Download and view the complete annual report
Please find page 224 of the 2006 RBS annual report below. You can navigate through the pages in the report by either clicking on the pages listed below, or by using the keyword search tool below to find specific information within the annual report.-
 1
1 -
2
-
3
-
4
-
5
-
6
-
7
-
8
-
9
-
10
-
11
-
12
-
13
-
14
-
15
-
16
-
17
-
18
-
19
-
20
-
21
-
22
-
23
-
24
-
25
-
26
-
27
-
28
-
29
-
30
-
31
-
32
-
33
-
34
-
35
-
36
-
37
-
38
-
39
-
40
-
41
-
42
-
43
-
44
-
45
-
46
-
47
-
48
-
49
-
50
-
51
-
52
-
53
-
54
-
55
-
56
-
57
-
58
-
59
-
60
-
61
-
62
-
63
-
64
-
65
-
66
-
67
-
68
-
69
-
70
-
71
-
72
-
73
-
74
-
75
-
76
-
77
-
78
-
79
-
80
-
81
-
82
-
83
-
84
-
85
-
86
-
87
-
88
-
89
-
90
-
91
-
92
-
93
-
94
-
95
-
96
-
97
-
98
-
99
-
100
-
101
-
102
-
103
-
104
-
105
-
106
-
107
-
108
-
109
-
110
-
111
-
112
-
113
-
114
-
115
-
116
-
117
-
118
-
119
-
120
-
121
-
122
-
123
-
124
-
125
-
126
-
127
-
128
-
129
-
130
-
131
-
132
-
133
-
134
-
135
-
136
-
137
-
138
-
139
-
140
-
141
-
142
-
143
-
144
-
145
-
146
-
147
-
148
-
149
-
150
-
151
-
152
-
153
-
154
-
155
-
156
-
157
-
158
-
159
-
160
-
161
-
162
-
163
-
164
-
165
-
166
-
167
-
168
-
169
-
170
-
171
-
172
-
173
-
174
-
175
-
176
-
177
-
178
-
179
-
180
-
181
-
182
-
183
-
184
-
185
-
186
-
187
-
188
-
189
-
190
-
191
-
192
-
193
-
194
-
195
-
196
-
197
-
198
-
199
-
200
-
201
-
202
-
203
-
204
-
205
-
206
-
207
-
208
-
209
-
210
-
211
-
212
-
213
-
 214
214 -
 215
215 -
 216
216 -
 217
217 -
 218
218 -
 219
219 -
 220
220 -
 221
221 -
 222
222 -
 223
223 -
 224
224 -
 225
225 -
 226
226 -
 227
227 -
 228
228 -
 229
229 -
 230
230 -
 231
231 -
 232
232 -
 233
233 -
 234
234 -
235
-
236
-
237
-
238
-
239
-
240
-
241
-
242
-
243
-
244
-
245
-
246
-
247
-
248
-
249
-
250
-
251
-
252
-
253
-
254
-
255
-
256
-
257
-
258
-
259
-
260
-
261
-
262
 |
 |

RBS Group • Annual Report and Accounts 2006 223
Financial statements
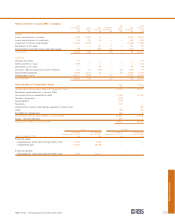
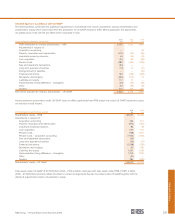
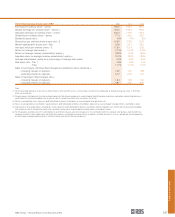
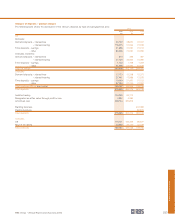
Pensions
Details of the Group’s pension schemes are provided in Note 3. The provisions of SFAS 87 ‘Employers’ Accounting for Pensions’ and
SFAS 158 have been applied to the main scheme and defined benefit plans of some of the subsidiaries, which together cover most of
the Group’s employees; the effect of the other schemes on the Group’s US GAAP reporting is considered to be inconsequential.
The required disclosures of SFAS 158 for these pension plans are set out below.
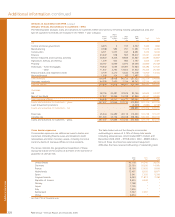
Main Other
Obligations and funded status scheme schemes Main scheme
2006 2006 2006 2005 2004
Change in benefit obligation: £m £m £m £m £m
Projected benefit obligation at beginning of year 19,293 1,997 21,290 16,192 13,963
Foreign exchange movements — (81) (81) ——
Service cost 596 91 687 457 420
Interest cost 914 91 1,005 860 768
Past service cost 4 8 12 3—
Net actuarial (loss)/gain (1,092) (136) (1,228) 2,302 1,568
Benefits and expenses paid (541) (25) (566) (521) (527)
Projected benefit obligation at end of year 19,174 1,945 21,119 19,293 16,192
Change in plan assets:
Fair value of plan assets at beginning of year 15,934 1,434 17,368 13,598 11,822
Foreign exchange movements — (59) (59) ——
Unrecognised losses 1,554 126 1,680 2,477 1,234
Employer’s contribution 427 109 536 380 1,069
Benefits and expenses paid (541) (25) (566) (521) (527)
Market value of plan assets at end of year 17,374 1,585 18,959 15,934 13,598
Funded status of plans 1,800 360 2,160 3,359 2,594
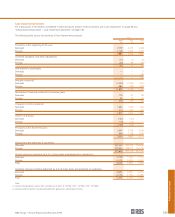
Change in accumulated other comprehensive income:
Foreign exchange movements — (5) (5)
Unrecognised losses 4,436 — 4,436
Other comprehensive income (43) (74) (117)
Accumulated other comprehensive income 4,393 (79) 4,314
Components of net periodic pension cost:
Service cost 596 91 687 457 420
Interest cost 914 91 1,005 860 768
Expected return on plan assets (1,028) (96) (1,124) (932) (840)
Amortisation of prior service cost 5 7 12 41
Amortisation of loss 371 5 376 364 263
Amortisation of net transition asset — — — (6) (8)
858 98 956 747 604
Redundancies 11 — 11 ——
Net periodic pension costs 869 98 967 747 604
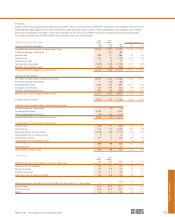
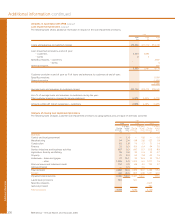
Assumptions
Main Other
scheme schemes
2006 2006 2006 2005 2004
Weighted average assumptions used at 31 December: % per annum % per annum % per annum % per annum % per annum
Discount rate for liabilities 5.3 5.3 5.3 4.8 5.4
Salary increases 4.2 3.5 4.1 4.0 4.0
Pension increases 2.9 2.1 2.8 2.7 2.7
Long-term rate of return on assets 6.9 6.8 6.9 6.5 6.7
2006 2005 2004
Weighted average allocations of market value of plan assets at 31 December: %%%%%
Equity shares 60.5 62.9 60.7 61.3 56.7
Debt securities 33.8 27.6 33.3 34.5 31.1
Other 5.7 6.7 6.0 4.2 12.2