Progressive 2004 Annual Report Download - page 20
Download and view the complete annual report
Please find page 20 of the 2004 Progressive annual report below. You can navigate through the pages in the report by either clicking on the pages listed below, or by using the keyword search tool below to find specific information within the annual report.-
 1
1 -
2
-
3
-
4
-
5
-
6
-
7
-
8
-
9
-
 10
10 -
 11
11 -
 12
12 -
 13
13 -
 14
14 -
 15
15 -
 16
16 -
 17
17 -
 18
18 -
 19
19 -
 20
20 -
 21
21 -
 22
22 -
 23
23 -
 24
24 -
 25
25 -
 26
26 -
 27
27 -
 28
28 -
 29
29 -
 30
30 -
31
-
32
-
33
-
34
-
35
-
36
-
37
-
38
-
39
-
40
-
41
-
42
-
43
-
44
-
45
-
46
-
47
-
48
-
49
-
50
-
51
-
52
-
53
-
54
-
55
 |
 |

APP.-B-20
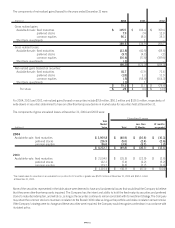
The components of other comprehensive income for the years ended December 31 were as follows:
2004 2003 2002
Tax Tax Tax
(Provision) After (Provision) After (Provision) After
(millions) Pretax Benefit Tax Pretax Benefit Tax Pretax Benefit Tax
Unrealized gains (losses)
arising during period:
Available-for-sale:
fixed maturities $ (48.0) $ 16.8 $ (31.2) $ 2.8 $ (.9) $ 1.9 $ 240.9 $ (84.3) $ 156.6
equity securities 241.4 (84.5) 156.9 431.6 (151.1) 280.5 (137.8) 48.2 (89.6)
Reclassification adjustment:1
Available-for-sale:
fixed maturities (74.4) 26.0 (48.4) (71.5) 25.0 (46.5) (13.8) 4.7 (9.1)
equity securities (93.0) 32.6 (60.4) 30.6 (10.7) 19.9 (26.2) 9.2 (17.0)
Net unrealized gains (losses) 26.0 (9.1) 16.9 393.5 (137.7) 255.8 63.1 (22.2) 40.9
Net unrealized gains
on forecasted transactions2(1.5) .5 (1.0) (1.5) .5 (1.0) 3.8 (1.3) 2.5
Foreign currency
translation adjustment33.9 — 3.9 .9—.9 ———
Other comprehensive
income $ 28.4 $ (8.6) $ 19.8 $ 392.9 $ (137.2) $ 255.7 $ 66.9 $ (23.5) $ 43.4
1Represents adjustments for gains (losses) realized in net income for securities held in the portfolio at December 31 of the preceding year.
2Entered into for the purpose of managing interest rate risk associated with debt issuances. See
Note 4 — Debt
. The Company expects to reclassify $1.5 million into income
within the next 12 months.
3Foreign currency translation adjustments have no tax effect.
10) Other Comprehensive Income
The Company’s management uses underwriting margin and combined ratio as primary measures of underwriting profitability. The under-
writing margin is the pretax profit (loss) expressed as a percent of net premiums earned (i.e., revenues). Combined ratio is the complement
of the underwriting margin. Following are the underwriting margins/combined ratios for the Company’s underwriting operations as of De-
cember 31:
2004 2003 2002
Underwriting Combined
Underwriting
Combined
Underwriting
Combined
(millions) Margin Ratio Margin Ratio Margin Ratio
Personal Lines – Agency 14.0% 86.0 12.0% 88.0 7.0% 93.0
Personal Lines – Direct 14.1 85.9 12.3 87.7 8.6 91.4
Total Personal Lines 14.1 85.9 12.1 87.9 7.5 92.5
Commercial Auto Business 21.1 78.9 17.5 82.5 9.1 90.9
Other businesses – indemnity 9.2 90.8 13.0 87.0 7.2 92.8
Total underwriting operations 14.9 85.1 12.7 87.3 7.6 92.4