Progressive 2004 Annual Report Download - page 18
Download and view the complete annual report
Please find page 18 of the 2004 Progressive annual report below. You can navigate through the pages in the report by either clicking on the pages listed below, or by using the keyword search tool below to find specific information within the annual report.-
 1
1 -
2
-
3
-
4
-
5
-
6
-
7
-
 8
8 -
 9
9 -
 10
10 -
 11
11 -
 12
12 -
 13
13 -
 14
14 -
 15
15 -
 16
16 -
 17
17 -
 18
18 -
 19
19 -
 20
20 -
 21
21 -
 22
22 -
 23
23 -
 24
24 -
 25
25 -
 26
26 -
 27
27 -
 28
28 -
29
-
30
-
31
-
32
-
33
-
34
-
35
-
36
-
37
-
38
-
39
-
40
-
41
-
42
-
43
-
44
-
45
-
46
-
47
-
48
-
49
-
50
-
51
-
52
-
53
-
54
-
55
 |
 |

APP.-B-18
The Company elected to account for terminations when they occur rather than include an attrition factor into its model.
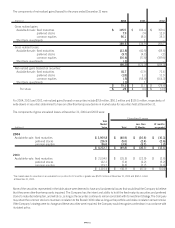
The following employee stock options were outstanding or exercisable as of December 31, 2004:
Options Outstanding Options Exercisable
Weighted Average Weighted Weighted
Range of Number of Remaining Average Number of Average
Exercise Prices Shares Contractual Life Exercise Price Shares Exercise Price
$15<20 2,002,814 4.32 years $ 18.64 1,296,332 $ 18.32
20<30 810,068 2.39 years 23.05 760,794 22.98
30<40 1,548,969 5.95 years 30.76 574,340 30.80
40<50 1,145,809 3.60 years 44.52 1,120,432 44.49
50 < 60 1,081,841 6.99 years 52.22 174,316 52.11
$15<60 6,589,501 3,926,214
Under SFAS 123, the Company used the modified Black-Scholes pricing model to calculate the fair value of the options awarded as of the
date of grant, including 23,571 options awarded to the non-employee directors during 2002. The Company used the following assumptions
in relation to the option awards granted in 2002:
2002
Option Term 6 years
Annualized Volatility Rate 39.5%
Risk-Free Rate of Return 4.66%
Dividend Yield .25%
Black-Scholes Value 44.6%
In addition to the employee incentive plans disclosed above, the Company registered 350,000 Common Shares for the 2003 Directors
Equity Incentive Plan, which provides for the granting of equity-based incentive awards to non-employee directors of the Company, and
600,000 Common Shares under the 1998 Directors’ Stock Option Plan. During 2004 and 2003, the Company granted 12,242 and 16,102,
respectively, time-based restricted stock awards, which vest within one year from the date of grant. During 2002, the Company granted
options for 23,571 shares to the non-employee directors. These awards have the same vesting, exercise and contract terms as the employee
stock option awards. As of December 31, 2004, 2003 and 2002, the directors stock options outstanding and exercisable were 242,277
shares, 311,061 shares and 343,044 shares, respectively.
A summary of all employee stock option activity during the years ended December 31 follows:
2004 2003 2002
Weighted Weighted Weighted
Number of Average Number of Average Number of Average
Options Outstanding Shares Exercise Price Shares Exercise Price Shares Exercise Price
Beginning of year 8,725,037 $ 30.43 11,947,271 $ 27.44 12,682,380 $ 23.81
Add (deduct):
Granted —— — — 1,194,192 52.17
Exercised (2,025,156) 24.94 (2,826,420) 17.47 (1,464,862) 15.11
Cancelled (110,380) 35.42 (395,814) 32.66 (464,439) 30.81
End of year 6,589,501 $ 32.04 8,725,037 $ 30.43 11,947,271 $ 27.44
Exercisable, end of year 3,926,214 $ 30.02 3,749,453 $ 25.49 4,542,722 $ 17.19
Available, end of year111,443,867 11,825,903 6,988,479
1Represents 7,141,717 shares and 4,302,150 shares available under the 1995 and 2003 Incentive Plans, respectively, after the granting of stock options and restricted
stock awards. The 1995 Incentive Plan expired on February 10, 2005, and the remaining shares thereunder are no longer available for future issuance.