Progressive 2004 Annual Report Download - page 2
Download and view the complete annual report
Please find page 2 of the 2004 Progressive annual report below. You can navigate through the pages in the report by either clicking on the pages listed below, or by using the keyword search tool below to find specific information within the annual report.-
 1
1 -
 2
2 -
 3
3 -
 4
4 -
 5
5 -
 6
6 -
 7
7 -
 8
8 -
 9
9 -
 10
10 -
 11
11 -
 12
12 -
 13
13 -
14
-
15
-
16
-
17
-
18
-
19
-
20
-
21
-
22
-
23
-
24
-
25
-
26
-
27
-
28
-
29
-
30
-
31
-
32
-
33
-
34
-
35
-
36
-
37
-
38
-
39
-
40
-
41
-
42
-
43
-
44
-
45
-
46
-
47
-
48
-
49
-
50
-
51
-
52
-
53
-
54
-
55
 |
 |

APP.-B-2
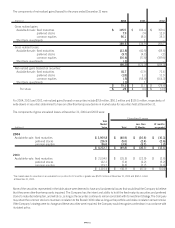
THE PROGRESSIVE CORPORATION AND SUBSIDIARIES
CONSOLIDATED STATEMENTS OF INCOME
(millions – except per share amounts)
For the years ended December 31, 2004 2003 2002
Revenues
Net premiums earned $13,169.9 $ 11,341.0 $ 8,883.5
Investment income 484.4 465.3 455.2
Net realized gains (losses) on securities 79.3 12.7 (78.6)
Service revenues 48.5 41.8 34.3
Other income1—31.2 —
Total revenues 13,782.1 11,892.0 9,294.4
Expenses
Losses and loss adjustment expenses 8,555.0 7,6 4 0 .4 6, 2 99. 1
Policy acquisition costs 1,418.0 1,249.1 1,031.6
Other underwriting expenses 1,238.6 1,010.1 874.2
Investment expenses 13.9 11.5 11.5
Service expenses 25.0 25.7 22.0
Interest expense 80.8 95.5 74.6
Total expenses 11,331.3 10,032.3 8,313.0
Net Income
Income before income taxes 2,450.8 1,859.7 9 81.4
Provision for income taxes 802.1 604.3 314.1
Net income $ 1,648.7 $ 1,255.4 $ 667.3
Computation of Earnings Per Share
Basic:
Average shares outstanding 212.9 216.8 219.0
Per share $7.74$ 5.79 $ 3.05
Diluted:
Average shares outstanding 212.9 216.8 219.0
Net effect of dilutive stock-based compensation 3.3 3.7 4.2
Total equivalent shares 216.2 220.5 223.2
Per share $ 7.63 $ 5.69 $ 2.99
1See
Note 3 — Income Taxes
for discussion.
See notes to consolidated financial statements.