Porsche 2003 Annual Report Download - page 112
Download and view the complete annual report
Please find page 112 of the 2003 Porsche annual report below. You can navigate through the pages in the report by either clicking on the pages listed below, or by using the keyword search tool below to find specific information within the annual report.-
 1
1 -
2
-
3
-
4
-
5
-
6
-
7
-
8
-
9
-
10
-
11
-
12
-
13
-
14
-
15
-
16
-
17
-
18
-
19
-
20
-
21
-
22
-
23
-
24
-
25
-
26
-
27
-
28
-
29
-
30
-
31
-
32
-
33
-
34
-
35
-
36
-
37
-
38
-
39
-
40
-
41
-
42
-
43
-
44
-
45
-
46
-
47
-
48
-
49
-
50
-
51
-
52
-
53
-
54
-
55
-
56
-
57
-
58
-
59
-
60
-
61
-
62
-
63
-
64
-
65
-
66
-
67
-
68
-
69
-
70
-
71
-
72
-
73
-
74
-
75
-
76
-
77
-
78
-
79
-
80
-
81
-
82
-
83
-
84
-
85
-
86
-
87
-
88
-
89
-
90
-
91
-
92
-
93
-
94
-
95
-
96
-
97
-
98
-
99
-
100
-
101
-
 102
102 -
 103
103 -
 104
104 -
 105
105 -
 106
106 -
 107
107 -
 108
108 -
 109
109 -
 110
110 -
 111
111 -
 112
112 -
 113
113 -
 114
114 -
 115
115 -
 116
116 -
 117
117 -
 118
118 -
 119
119 -
 120
120 -
 121
121 -
 122
122 -
123
-
124
-
125
-
126
-
127
-
128
-
129
-
130
-
131
-
132
-
133
-
134
-
135
-
136
-
137
-
138
-
139
-
140
 |
 |
108
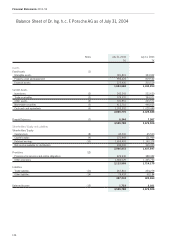
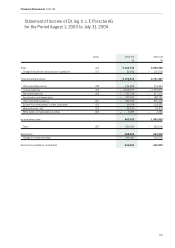
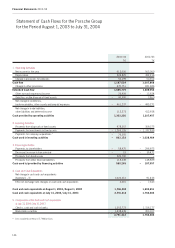
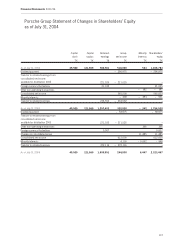
Financial Statements 2003 ⁄ 04
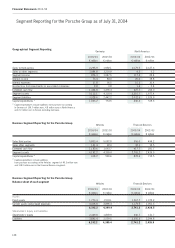
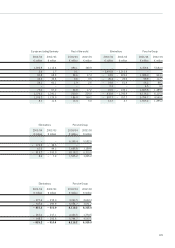
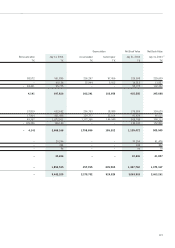
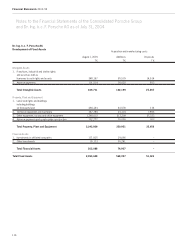
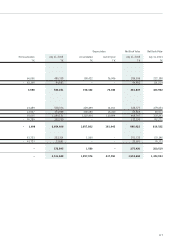
Segment Reporting for the Porsche Group as of July 31, 2004
Germany North America
2003 ⁄ 04 2002 ⁄ 03 2003 ⁄ 04 2002 ⁄ 03
€ million € million € million € million
Sales to third parties 2,295.9 1,992.1 2,179.5 2,127.6
Sales to other segments 3,484.8 3,203.9 4.3 5.2
Segment income 876.3 1,047.5 117.2 22.4
Interest income 73.4 84.0 20.0 19.8
Interest expenses 37.8 56.5 10.3 30.4
Income/loss from investments in associated companies 2.8 0.8 1.6 – 0.4
Extended cash flow 1,324.8 1,235.3 227.7 216.0
Segment assets 5,112.1 4,118.4 2,215.7 1,977.4
Segment liabilities 3,028.6 2,442.2 2,032.6 1,525.9
Capital expenditures 1) 1,023.2 753.5 446.2 519.6
1) Capital expenditures include additions from purchase accounting
in Germany of 156.7 million euro, 4.8 million euro in North America
and 2.0 million euro in Europe excluding Germany.
Geographical Segment Reporting
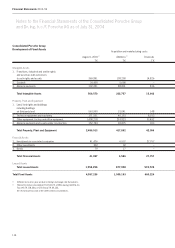
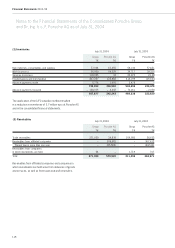
Business Segment Reporting for the Porsche Group
Business Segment Reporting for the Porsche Group
Balance sheet of each segment Vehicles Financial Services
2003 ⁄ 04 2002 ⁄ 03 2003 ⁄ 04 2002 ⁄ 03
€ million € million € million € million
Assets
Fixed assets 1,773.4 1,503.1 1,567.7 1,375.2
Current assets and prepaid expenses 4,418.8 2,896.3 1,173.5 1,051.3
6,192.2 4,399.4 2,741.2 2,426.5
Shareholders’ Equity and Liabilities
Shareholders’ equity 2,349.8 1,839.9 240.7 131.7
Liabilities 3,842.4 2,559.5 2,500.5 2,294.8
6,192.2 4,399.4 2,741.2 2,426.5
Vehicles Financial Services
2003 ⁄ 04 2002 ⁄ 03 2003 ⁄ 04 2002 ⁄ 03
€ million € million € million € million
Sales third parties 5,803.4 5,082.8 556.0 499.2
Sales other segments 141.4 22.0 32.1 12.5
Extended cash flow 1,180.6 1,063.7 417.7 281.7
Segment assets 6,192.2 4,399.4 2,741.2 2,426.5
Capital expenditures 2) 618.2 590.6 878.6 712.5
2) Capital expenditures include additions
from purchase accounting in the Vehicles segment of 45.3 million euro
and 118.2 million euro in the Financial Services segment.