Pioneer 2015 Annual Report Download - page 12
Download and view the complete annual report
Please find page 12 of the 2015 Pioneer annual report below. You can navigate through the pages in the report by either clicking on the pages listed below, or by using the keyword search tool below to find specific information within the annual report.-
 1
1 -
 2
2 -
 3
3 -
 4
4 -
 5
5 -
 6
6 -
 7
7 -
 8
8 -
 9
9 -
 10
10 -
 11
11 -
 12
12 -
 13
13 -
 14
14 -
 15
15 -
 16
16 -
 17
17 -
 18
18 -
 19
19 -
 20
20 -
 21
21 -
 22
22 -
23
-
24
-
25
-
26
-
27
-
28
-
29
-
30
-
31
-
32
 |
 |

Year ended March 31, 2015,
compared with year ended March 31, 2014
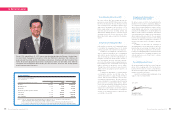
Financial Position
Total assets as of March 31, 2015, were ¥328,277
million, an increase of ¥364 million from March 31,
2014, owing to an increase in cash and deposits that
more than offset decreases in inventories and trade
receivables. Inventories decreased ¥7,076 million, to
¥63,295 million, resulting from transfers of inventory
stock associated with business transfers more than
offsetting the effect of the Japanese yen’s deprecia-
tion. Trade receivables decreased ¥6,402 million, to
¥79,158 million, mainly due to the fact that fourth-
quarter sales were lower than in the fourth quarter of
the previous fiscal year, reflecting the effect of busi-
ness transfers. Cash and deposits increased ¥16,763
million, to ¥52,160 million, mainly as a result of busi-
ness transfers.
Total liabilities as of March 31, 2015, were
¥221,211 million, a decrease of ¥28,886 million from
March 31, 2014. This was the result of a ¥53,210
million reduction in borrowings, which more than off-
set increases of ¥15,861 million in accrued expenses,
mainly owing to the recording of restructuring costs
and ¥4,702 million in trade payables.
Total equity as of March 31, 2015, was ¥107,066
million, an increase of ¥29,250 million from March
31, 2014, reflecting net income of ¥14,632 million
and a ¥12,319 million increase in foreign currency
translation adjustments from the Japanese yen’s
depreciation.
Results of Operations
• Net sales
In fiscal 2015, consolidated net sales were roughly
flat with the previous fiscal year, at ¥501,676 million.
Sales of Home Electronics declined, but this was
offset by increased sales of Car Electronics, reflecting
the Japanese yen’s depreciation.
Car Electronics sales grew 2.2% year on year, to
¥355,591 million, reflecting the effect of the Japanese
yen’s depreciation. Sales of car navigation systems
declined. Consumer-market sales of car navigation
systems rose in overseas markets including North
America, Europe, and China, but Japan saw a decline
as a result of a shift to lower-priced models and a
Management’s Discussion and Analysis of Financial Position, Results of Operations, and Cash Flows
• Other income (expenses)—net
In fiscal 2015, other income (expenses)—net im-
proved by ¥22,956 million, to other income—net
of ¥17,452 million, compared with other expenses—
net of ¥5,504 million in fiscal 2014. This reflected a
¥48,415 million gain from the transfer of the DJ equip-
ment business, which more than offset a decrease
in operating income, and a ¥6,450 million foreign
exchange loss, as well as a ¥3,526 million loss from
the transfer of the home AV and its related businesses
and restructuring costs of ¥13,250 million in line with
organizational streamlining, despite the negative ef-
fect of foreign exchange rate movements.
• Income before income taxes and minority interests
As a result of the foregoing, income before income
taxes and minority interests increased to ¥25,230 mil-
lion, from ¥5,665 million in fiscal 2014.
• Income taxes
Income taxes for fiscal 2015 increased to ¥11,142
million, compared with ¥5,159 million for fiscal 2014,
principally due to a reversal of deferred tax assets.
• Net income
As a result of the above, net income rose to ¥14,632
million, from ¥531 million in fiscal 2014.
Cash Flows
During fiscal 2015, operating activities provided net
cash in the amount of ¥34,564 million, a ¥322 mil-
lion increase from fiscal 2014. Although net gain on
business transfers of ¥44,889 million was posted
and trade payables turned around to a ¥3,843 million
decrease in fiscal 2015, compared with an ¥11,278
million increase in fiscal 2014, trade receivables de-
creased ¥10,807 million in fiscal 2015, compared
with an ¥8,648 million increase in fiscal 2014, and
the amount of increase in accrued expenses grew
¥13,236 million, which resulted in an overall increase.
Investing activities provided net cash in the
amount of ¥36,880 million, compared with ¥21,862
million used in fiscal 2014. This was mainly because
of a ¥57,124 million cash inflow from business
transfers.
drop-off in consumption in the wake of accelerated
demand ahead of the consumption tax increase in
April 2014, which resulted in an overall decline. OEM
sales declined in Japan, but grew mainly in China and
North America, which resulted in an overall increase.
Sales of car audio products increased. Consumer-
market sales were flat year on year, with a decline in
Europe and Japan, despite growth mainly in Central
and South America and North America. OEM sales
rose, with increases in North America, Southeast Asia,
and Europe more than offsetting a decrease in China.
OEM sales accounted for 57% of total Car Electronics
sales, compared with 54% in the previous fiscal year.
By geographic region, sales in Japan declined 13.2%,
to ¥131,347 million, while overseas sales rose 13.9%,
to ¥224,244 million.
Home Electronics sales declined 6.3% year on
year, to ¥104,697 million, reflecting lower sales of
home AV products and the transfers of the home AV
and DJ equipment businesses. By geographic region,
sales in Japan grew 2.9%, to ¥37,139 million, while
overseas sales declined 10.7%, to ¥67,558 million.
In the Others segment, sales rose 8.2% year on
year, to ¥41,388 million, mainly from increased sales
of factory automation systems. By geographic region,
sales in Japan grew 8.5%, to ¥24,594 million, and
overseas sales rose 7.7%, to ¥16,794 million.
• Operating income
Cost of sales increased to ¥403,072 million from
¥396,705 million a year earlier. Cost of sales ac-
counted for 80.3% of net sales, worsening by 0.7
percentage point from 79.7% in fiscal 2014, mainly
resulting from the negative effect of foreign exchange
rate movements. Selling, general and administrative
(SG&A) expenses increased to ¥90,826 million from
¥90,177 million in fiscal 2014, mainly reflecting foreign
exchange rate movements. As a result, operating in-
come decreased to ¥7,778 million in fiscal 2015,
compared with ¥11,169 million in fiscal 2014. R&D
expenses, which were included in cost of sales and
SG&A expenses, increased 4.9% to ¥28,196 mil-
lion, representing 5.6% of net sales. R&D expenses
were mostly incurred to enhance our technological
advantage in our strategic products, such as car
navigation systems.
Financing activities used net cash in the amount
of ¥55,424 million, a ¥54,537 million increase from
fiscal 2014. This reflected a ¥44,795 million large
decrease in the amount of net borrowings from the
previous fiscal year, and the absence of the year-
earlier ¥8,643 million inflow from the capital increase
through third-party allotments.
Foreign currency translation adjustments on cash
and cash equivalents were a positive ¥1,752 million, a
¥308 million increase from March 31, 2014.
As a result, cash and cash equivalents as of
March 31, 2015, totaled ¥51,676 million, a ¥17,772
million increase from March 31, 2014.
Financial Review
20 Pioneer Corporation Annual Report 2015 21
Pioneer Corporation Annual Report 2015