Pioneer 2015 Annual Report Download - page 11
Download and view the complete annual report
Please find page 11 of the 2015 Pioneer annual report below. You can navigate through the pages in the report by either clicking on the pages listed below, or by using the keyword search tool below to find specific information within the annual report.-
 1
1 -
 2
2 -
 3
3 -
 4
4 -
 5
5 -
 6
6 -
 7
7 -
 8
8 -
 9
9 -
 10
10 -
 11
11 -
 12
12 -
 13
13 -
 14
14 -
 15
15 -
 16
16 -
 17
17 -
 18
18 -
 19
19 -
 20
20 -
 21
21 -
 22
22 -
23
-
24
-
25
-
26
-
27
-
28
-
29
-
30
-
31
-
32
 |
 |

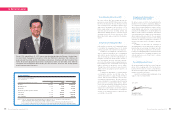
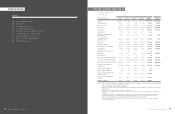
Pioneer Corporation and Its Subsidiaries
Years ended March 31
In millions of yen and
thousands of U.S. dollars 2011 2012 2013 2014 2015 2015
Net sales ¥457,545 ¥436,753 ¥451,841 ¥498,051 ¥501,676 $4,180,633
Operating income 15,817 12,514 5,997 11,169 7,778 64,817
Net income (loss) 10,350 3,670 (19,552) 531 14,632 121,933
Total assets 309,712 322,012 311,325 327,913 328,277 2,735,642
Total equity 88,454 89,037 81,576 77,816 107,066 892,217
Equity ratio (%) 27.4 26.1 24.5 22.1 31.0
Net income (loss) per share
(yen/U.S. dollars) 32.24 11.43 (60.90) 1.49 39.85 0.33
Total equity per share
(yen/U.S. dollars) 264.78 261.98 237.97 197.33 277.05 2.31
Inventories 59,616 66,871 76,466 70,371 63,295 527,458
Capital expenditures 22,148 24,769 34,965 26,053 25,046 208,717
Depreciation and amortization 29,842 24,568 25,413 24,883 23,543 196,192
R&D expenses 33,040 34,590 33,671 26,891 28,196 234,967
R&D expenses to net sales (%) 7.2 7.9 7.5 5.4 5.6
Borrowings 87,832 89,511 96,212 87,448 34,238 285,317
D/E ratio (times) 1.0 1.1 1.3 1.2 0.3
Cash flows from operating activities 37,454 18,213 1,179 34,242 34,564 288,033
Cash flows from investing activities 3,886 (21,781) (35,239) (21,862) 36,880 307,333
Cash flows from financing activities (74,244) 1,719 7,018 (887) (55,424) (461,867)
Cash and cash equivalents
at end of year 47,566 45,953 20,967 33,904 51,676 430,633
Return on assets (ROA) (%) 3.0 1.2 (6.2) 0.2 4.5
Return on equity (ROE) (%) 12.0 4.3 (24.4) 0.7 16.8
Average foreign exchange rate
(yen/U.S. dollars) 85.72 79.08 83.10 100.24 109.93
Average foreign exchange rate
(yen/euro) 113.12 108.98 107.14 134.37 138.77
Number of employees 26,785 24,765 23,926 22,193 19,404
Notes: 1. The U.S. dollar amounts represent translations of Japanese yen, for convenience only, at the rate of ¥120=U.S.$1.00, the
approximate current rate prevailing on March 31, 2015.
2. Amounts less than presentation units are rounded.
3. Net income (loss) per share and total equity per share are calculated by using the number of issued shares after deducting
treasury stock.
4. The amount of borrowings excludes capital lease obligations.
5. Cash and cash equivalents at end of year exclude time deposits which become due over three months of the date of
acquisition.
6. Return on assets (ROA) is calculated by dividing net income (loss) for the term by the average amount of total assets
during the term, and return on equity (ROE) is calculated by dividing net income (loss) for the term by the average
amount of equity (equity calculated as total equity minus minority interests) during the term.
7. The number of employees excludes contract employees with a contract period of less than one year and temporary/
other contract employees.
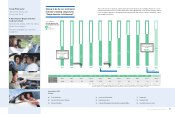
Contents
19 Five-Year Summary of Operations
20 Financial Review
22 Consolidated Balance Sheet
24 Consolidated Statement of Income
24 Consolidated Statement of Comprehensive Income
25 Consolidated Statement of Changes in Equity
26 Consolidated Statement of Cash Flows
27 Notes to Consolidated Financial Statements
58 Independent Auditor’s Report
Five-Year Summary of Operations Financial Section
19
Pioneer Corporation Annual Report 2015
18 Pioneer Corporation Annual Report 2015