Pfizer 2007 Annual Report Download - page 68
Download and view the complete annual report
Please find page 68 of the 2007 Pfizer annual report below. You can navigate through the pages in the report by either clicking on the pages listed below, or by using the keyword search tool below to find specific information within the annual report.-
 1
1 -
2
-
3
-
4
-
5
-
6
-
7
-
8
-
9
-
10
-
11
-
12
-
13
-
14
-
15
-
16
-
17
-
18
-
19
-
20
-
21
-
22
-
23
-
24
-
25
-
26
-
27
-
28
-
29
-
30
-
31
-
32
-
33
-
34
-
35
-
36
-
37
-
38
-
39
-
40
-
41
-
42
-
43
-
44
-
45
-
46
-
47
-
48
-
49
-
50
-
51
-
52
-
53
-
54
-
55
-
56
-
57
-
 58
58 -
 59
59 -
 60
60 -
 61
61 -
 62
62 -
 63
63 -
 64
64 -
 65
65 -
 66
66 -
 67
67 -
 68
68 -
 69
69 -
 70
70 -
 71
71 -
 72
72 -
 73
73 -
 74
74 -
 75
75 -
 76
76 -
 77
77 -
 78
78 -
79
-
80
-
81
-
82
-
83
-
84
-
85
 |
 |

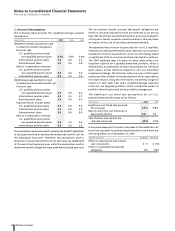
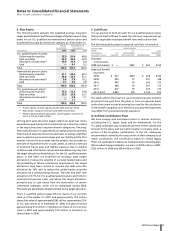
66 2007 Financial Report
Notes to Consolidated Financial Statements
Pfizer Inc and Subsidiary Companies
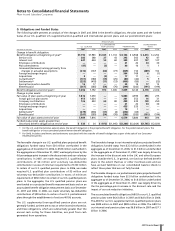
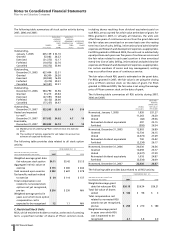
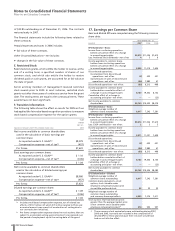
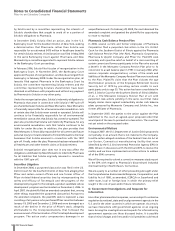
The following table summarizes all stock option activity during
2007, 2006 and 2005:
_____________________________________________________________________________________________________________________
WEIGHTED- WEIGHTED-
AVERAGE AVERAGE
EXERCISE REMAINING AGGREGATE
PRICE CONTRACTUAL INTRINSIC
SHARES PER TERM VALUE(a)
(THOUSANDS) SHARE (YEARS) (MILLIONS)
Outstanding,
January 1, 2005 635,139 $ 33.10
Granted 52,082 26.22
Exercised (31,373) 12.17
Forfeited (10,072) 32.76
Cancelled (18,372) 35.40
Outstanding,
December 31, 2005 627,404 33.51
Granted 69,300 26.20
Exercised (38,953) 16.09
Forfeited (9,370) 39.01
Cancelled (63,591) 32.51
Outstanding,
December 31, 2006 584,790 33.96
Granted 51,215 25.84
Exercised (27,391) 19.68
Forfeited (8,152) 28.00
Cancelled (77,257) 34.47
Outstanding,
December 31, 2007 523,205 33.93 4.8 $10
Vested and expected
to vest(b),
December 31, 2007 517,032 34.02 4.7 10
Exercisable,
December 31, 2007 380,823 36.74 3.5 10
(a) Market price of underlying Pfizer common stock less exercise
price.
(b) The number of options expected to vest takes into account an
estimate of expected forfeitures.
The following table provides data related to all stock option
activity:
YEAR ENDED DEC. 31,
_________________________________________________
(MILLIONS OF DOLLARS, EXCEPT PER
STOCK OPTION AMOUNTS AND YEARS) 2007 2006 2005
Weighted-average grant date
fair value per stock option $4.11 $5.42 $5.15
Aggregate intrinsic value on
exercise $ 173 $ 380 $ 442
Cash received upon exercise $ 532 $ 622 $ 378
Tax benefits realized related
to exercise $54 $ 114 $ 137
Total compensation cost
related to nonvested stock
options not yet recognized,
pre-tax $ 216 $ 330 N/A
Weighted-average period in
years over which stock option
compensation cost is
expected to be recognized 1.2 1.1 N/A
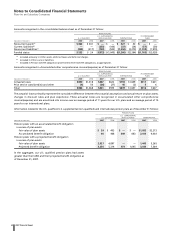
C. Restricted Stock Units
RSUs, which entitle the holder to receive, at the end of a vesting
term, a specified number of shares of Pfizer common stock,
including shares resulting from dividend equivalents paid on
such RSUs, are accounted for at fair value at the date of grant. For
RSUs granted in 2007, in virtually all instances, the units vest
after three years of continuous service from the grant date and
the fair values are amortized on an even basis over the vesting
term into Cost of sales, Selling, informational and administrative
expenses and Research and development expenses, as appropriate.
For RSUs granted in 2006 and 2005, the units vest in substantially
equal portions each year over five years of continuous service and
the fair value related to each year’s portion is then amortized
evenly into Cost of sales, Selling, informational and administrative
expenses and Research and development expenses, as appropriate.
For certain members of senior and key management, vesting
may occur after three years of continuous service.
The fair value of each RSU grant is estimated on the grant date.
For RSUs granted in 2007, the fair value is set using the closing
price of Pfizer common stock on the date of grant. For RSUs
granted in 2006 and 2005, the fair value is set using the average
price of Pfizer common stock on the date of grant.
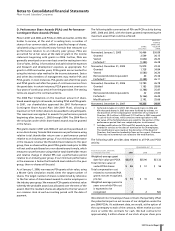
The following table summarizes all RSU activity during 2007,
2006 and 2005:
_____________________________________________________________________________________________________________________
WEIGHTED-
AVERAGE
GRANT DATE
SHARES FAIR VALUE
(THOUSANDS) PER SHARE
Nonvested, January 1, 2005 1,920 $31.27
Granted 11,263 26.20
Vested (82) 29.56
Reinvested dividend equivalents 297 25.15
Forfeited (595) 26.34
Nonvested, December 31, 2005 12,803 26.89
Granted 12,734 26.15
Vested (3,573) 27.29
Reinvested dividend equivalents 700 25.42
Forfeited (2,334) 26.17
Nonvested, December 31, 2006 20,330 26.56
Granted 10,459 25.77
Vested (5,337) 27.29
Reinvested dividend equivalents 1,018 24.87
Forfeited (3,534) 26.09
Nonvested, December 31, 2007 22,936 26.37
The following table provides data related to all RSU activity:
YEAR ENDED DEC. 31,
____________________________________________________
(MILLIONS OF DOLLARS, EXCEPT PER
RSU AMOUNTS AND YEARS) 2007 2006 2005
Weighted-average grant
date fair value per RSU $26.18 $26.34 $26.21
Total fair value of shares
vested $ 146 $98 $ 2
Total compensation cost
related to nonvested RSU
awards not yet recognized,
pre-tax $ 254 $ 270 $ 180
Weighted-average period
in years over which RSU
cost is expected to be
recognized 2.1 3.8 4.0