Pfizer 2007 Annual Report Download - page 64
Download and view the complete annual report
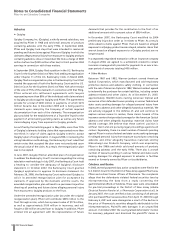
Please find page 64 of the 2007 Pfizer annual report below. You can navigate through the pages in the report by either clicking on the pages listed below, or by using the keyword search tool below to find specific information within the annual report.-
 1
1 -
2
-
3
-
4
-
5
-
6
-
7
-
8
-
9
-
10
-
11
-
12
-
13
-
14
-
15
-
16
-
17
-
18
-
19
-
20
-
21
-
22
-
23
-
24
-
25
-
26
-
27
-
28
-
29
-
30
-
31
-
32
-
33
-
34
-
35
-
36
-
37
-
38
-
39
-
40
-
41
-
42
-
43
-
44
-
45
-
46
-
47
-
48
-
49
-
50
-
51
-
52
-
53
-
 54
54 -
 55
55 -
 56
56 -
 57
57 -
 58
58 -
 59
59 -
 60
60 -
 61
61 -
 62
62 -
 63
63 -
 64
64 -
 65
65 -
 66
66 -
 67
67 -
 68
68 -
 69
69 -
 70
70 -
 71
71 -
 72
72 -
 73
73 -
 74
74 -
75
-
76
-
77
-
78
-
79
-
80
-
81
-
82
-
83
-
84
-
85
 |
 |

62 2007 Financial Report
Notes to Consolidated Financial Statements
Pfizer Inc and Subsidiary Companies
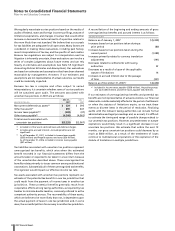
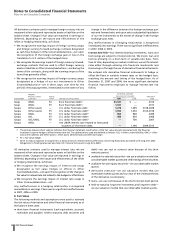
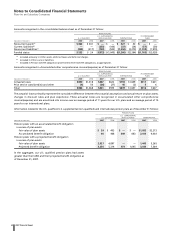
In the aggregate, our U.S. qualified pension plans had assets
greater than their ABO and their projected benefit obligation as
of December 31, 2007.
Information related to the U.S. qualified, U.S. supplemental (non-qualified) and international pension plans as of December 31 follows:
PENSION PLANS
_______________________________________________________________________________
U.S. SUPPLEMENTAL
U.S. QUALIFIED (NON-QUALIFIED) INTERNATIONAL
(MILLIONS OF DOLLARS) 2007 2006 2007 2006 2007 2006
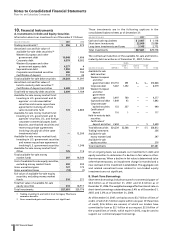
Pension plans with an accumulated benefit obligation
in excess of plan assets:
Fair value of plan assets $39 $ 403 $— $— $1,052 $2,273
Accumulated benefit obligation 40 468 849 883 2,413 4,002
Pension plans with a projected benefit obligation
in excess of plan assets:
Fair value of plan assets 2,927 4,897 ——1,445 5,265
Projected benefit obligation 3,256 5,314 973 1,045 3,033 7,569
PENSION PLANS
U.S. SUPPLEMENTAL POSTRETIREMENT
U.S. QUALIFIED (NON-QUALIFIED) INTERNATIONAL PLANS
(MILLIONS OF DOLLARS) 2007 2006 2007 2006 2007 2006 2007 2006
Noncurrent assets(a) $ 862 $ 441 $— $—$ 327 $40$—$—
Current liabilities(b) ——(253) (100) (37) (34) (57) (50)
Noncurrent liabilities(c) (329) (417) (720) (945) (1,550) (2,270) (1,708) (1,970)
Funded status $ 533 $ 24 $(973) $(1,045) $(1,260) $(2,264) $(1,765) $(2,020)
(a) Included primarily in Other assets, deferred taxes and deferred charges.
(b) Included in Other current liabilities.
(c) Included in Pension benefit obligations and Postretirement benefit obligations, as appropriate.
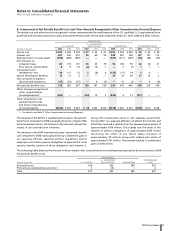
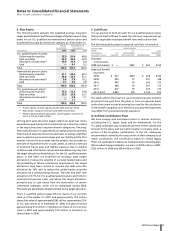
Amounts recognized in the consolidated balance sheet as of December 31 follow:
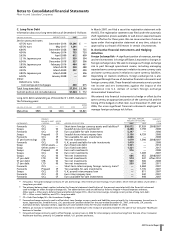
Amounts recognized in Accumulated other comprehensive income/(expense) as of December 31 follow:
PENSION PLANS
U.S. SUPPLEMENTAL POSTRETIREMENT
U.S. QUALIFIED (NON-QUALIFIED) INTERNATIONAL PLANS
(MILLIONS OF DOLLARS) 2007 2006 2007 2006 2007 2006 2007 2006
Actuarial losses $890 $1,418 $487 $622 $794 $1,649 $311 $621
Prior service costs/(credits) and other (4) 50 (26) (27) 45 (2) 56
Total $886 $1,468 $461 $595 $839 $1,647 $316 $627
The actuarial losses primarily represent the cumulative difference between the actuarial assumptions and actual return on plan assets,
changes in discount rates and plan experience. These actuarial losses are recognized in Accumulated other comprehensive
income/(expense) and are amortized into income over an average period of 11 years for our U.S. plans and an average period of 14
years for our international plans.