Pfizer 2007 Annual Report Download - page 65
Download and view the complete annual report
Please find page 65 of the 2007 Pfizer annual report below. You can navigate through the pages in the report by either clicking on the pages listed below, or by using the keyword search tool below to find specific information within the annual report.-
 1
1 -
2
-
3
-
4
-
5
-
6
-
7
-
8
-
9
-
10
-
11
-
12
-
13
-
14
-
15
-
16
-
17
-
18
-
19
-
20
-
21
-
22
-
23
-
24
-
25
-
26
-
27
-
28
-
29
-
30
-
31
-
32
-
33
-
34
-
35
-
36
-
37
-
38
-
39
-
40
-
41
-
42
-
43
-
44
-
45
-
46
-
47
-
48
-
49
-
50
-
51
-
52
-
53
-
54
-
 55
55 -
 56
56 -
 57
57 -
 58
58 -
 59
59 -
 60
60 -
 61
61 -
 62
62 -
 63
63 -
 64
64 -
 65
65 -
 66
66 -
 67
67 -
 68
68 -
 69
69 -
 70
70 -
 71
71 -
 72
72 -
 73
73 -
 74
74 -
 75
75 -
76
-
77
-
78
-
79
-
80
-
81
-
82
-
83
-
84
-
85
 |
 |

2007 Financial Report 63
Notes to Consolidated Financial Statements
Pfizer Inc and Subsidiary Companies
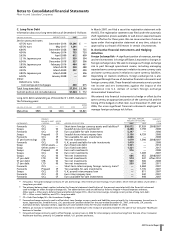
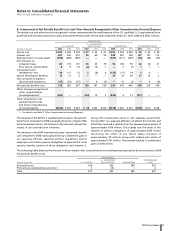
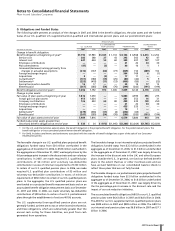
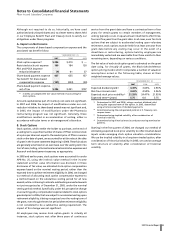
E. Plan Assets
The following table presents the weighted-average long-term
target asset allocations and the percentages of the fair value of plan
assets for our U.S. qualified and international pension plans and
postretirement plans by investment category as of December 31:
TARGET PERCENTAGE OF
ALLOCATION PLAN ASSETS
(PERCENTAGES) 2007 2007 2006
U.S. qualified pension plans:
Global equity securities 55.0 61.4 68.6
Debt securities 35.0 23.6 22.8
Alternative investments(a) 10.0 10.9 8.4
Cash — 4.1 0.2
Total 100.0 100.0 100.0
International pension plans:
Global equity securities 61.1 63.2 62.2
Debt securities 28.8 23.3 23.7
Alternative investments(b) 9.4 7.9 10.3
Cash 0.7 5.6 3.8
Total 100.0 100.0 100.0
U.S. postretirement plans(c):
Global equity securities 75.0 72.3 74.8
Debt securities 25.0 23.8 23.1
Alternative investments(a) — 2.8 2.1
Cash — 1.1 —
Total 100.0 100.0 100.0
(a) Private equity, venture capital, private debt and real estate.
(b) Real estate, insurance contracts and other investments.
(c) Reflects postretirement plan assets, which support a portion of
our U.S. retiree medical plans.
All long-term asset allocation targets reflect our asset class return
expectations and tolerance for investment risk within the context
of the respective plans’ long-term benefit obligations. The long-
term asset allocation is supported by an analysis that incorporates
historical and expected returns by asset class, as well as volatilities
and correlations across asset classes and our liability profile. This
analysis, referred to as an asset-liability analysis, also provides an
estimate of expected returns on plan assets, as well as a forecast
of potential future asset and liability balances. Due to market
conditions and other factors, actual asset allocations may vary from
the target allocation outlined above. For the U.S. qualified pension
plans, in late 2007, we modified our strategic asset target
allocation to reduce the volatility of our plan funded status and
the probability of future contribution requirements. Our target
allocations have been revised to increase the debt securities
allocation by 10% and to reduce the global equity securities
allocation by a corresponding amount. The year-end 2007 cash
allocation of 4.1% for U.S. qualified pensions plans and 5.6% for
international pension plans was above the target allocation,
primarily due to cash raised from the termination of certain
investment strategies, which will be redeployed during 2008.
The assets are periodically rebalanced back to the target allocation.
The U.S. qualified pension plans held no shares of our common
stock as of December 31, 2007, and approximately 10.2 million
shares (fair value of approximately $263 million, representing 3.3%
of U.S. plan assets) as of December 31, 2006. The plans received
approximately $12 million in dividends on shares of our common
stock in 2007 and approximately $10 million in dividends on
these shares in 2006.
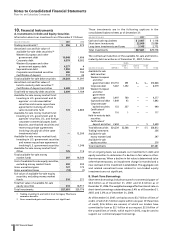
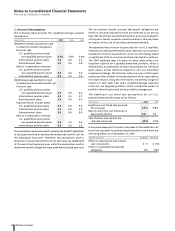
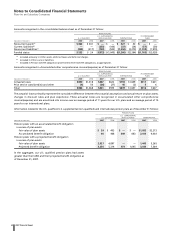
F. Cash Flows
It is our practice to fund amounts for our qualified pension plans
that are at least sufficient to meet the minimum requirements set
forth in applicable employee benefit laws and local tax laws.
The following table presents expected cash flow information:
FOR THE YEAR PENSION PLANS
___________________________________________________
ENDED U.S. POST-
DECEMBER 31, U.S. SUPPLEMENTAL RETIREMENT
(MILLIONS OF DOLLARS) QUALIFIED (NON-QUALIFIED) INTERNATIONAL PLANS
Employer
contributions:
2008 (estimated) $ — $253 $ 367 $164
Expected benefit
payments:
2008 $ 527 $253 $ 328 $164
2009 425 77 331 168
2010 441 76 342 170
2011 456 76 361 173
2012 477 75 374 173
2013–2017 2,823 379 2,102 812
The table reflects the total U.S. and international plan benefits
projected to be paid from the plans or from our general assets
under the current actuarial assumptions used for the calculation
of the benefit obligation and, therefore, actual benefit payments
may differ from projected benefit payments.
G. Defined Contribution Plans
We have savings and investment plans in several countries,
including the U.S., Japan, Spain and the Netherlands. For the
U.S. plans, employees may contribute a portion of their salaries and
bonuses to the plans, and we match, largely in company stock, a
portion of the employee contributions. In the U.S., employees
are permitted to diversify all or any portion of their company stock
match contribution. The contribution match for certain legacy
Pfizer U.S. participants is held in an employee stock ownership plan.
We recorded charges related to our plans of $203 million in 2007,
$222 million in 2006 and $234 million in 2005.