Pepsi 2012 Annual Report Download - page 5
Download and view the complete annual report
Please find page 5 of the 2012 Pepsi annual report below. You can navigate through the pages in the report by either clicking on the pages listed below, or by using the keyword search tool below to find specific information within the annual report.-
 1
1 -
 2
2 -
 3
3 -
 4
4 -
 5
5 -
 6
6 -
 7
7 -
 8
8 -
 9
9 -
 10
10 -
 11
11 -
 12
12 -
 13
13 -
 14
14 -
 15
15 -
 16
16 -
17
-
18
-
19
-
20
-
21
-
22
-
23
-
24
-
25
-
26
-
27
-
28
-
29
-
30
-
31
-
32
-
33
-
34
-
35
-
36
-
37
-
38
-
39
-
40
-
41
-
42
-
43
-
44
-
45
-
46
-
47
-
48
-
49
-
50
-
51
-
52
-
53
-
54
-
55
-
56
-
57
-
58
-
59
-
60
-
61
-
62
-
63
-
64
-
65
-
66
-
67
-
68
-
69
-
70
-
71
-
72
-
73
-
74
-
75
-
76
-
77
-
78
-
79
-
80
-
81
-
82
-
83
-
84
-
85
-
86
-
87
-
88
-
89
-
90
-
91
-
92
-
93
-
94
-
95
-
96
-
97
-
98
-
99
-
100
-
101
-
102
-
103
-
104
-
105
-
106
-
107
-
108
-
109
-
110
-
111
-
112
-
113
-
114
 |
 |

2012 PEPSICO ANNUAL REPORT 3
1 Organic results are non-GAAP financial measures that exclude certain items. See page 60 for
a reconciliation to the most directly comparable financial measure in accordance with GAAP.
2 Core results are non-GAAP financial measures that exclude certain items. See page 58 for a
reconciliation to the most directly comparable financial measure in accordance with GAAP.
3 Core results are non-GAAP financial measures that exclude certain items. See pages 106-107 for
reconciliations to the most directly comparable financial measures in accordance with GAAP.
4 Represents a non-GAAP financial measure that excludes certain items. See page 67 for a reconciliation
to the most directly comparable financial measure in accordance with GAAP.
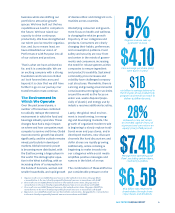
$1B
+$1 billion in savings delivered in
the rst year of our productivity
program and remain on track to
deliver $3 billion by 2015.
$4.10
Core earnings per share ()
were $4.102 in 2012.
5%
Organic revenue was up
5 percent1 in 2012.
$7.4B
$6.5B
$6.5 billion was returned to
shareholders through share
repurchases and dividends.
28%
Achieved a core net return
on invested capital3 () of
15 percent and core return on
equity3 () of 28 percent.
Management operating cash
ow4, excluding certain items,
reached $7.4 billion.
business while also shifting our
portfolio to attractive growth
spaces. We have built out the key
capabilities we need to compete in
the future. We have raised our
capacity to drive continuous
productivity. We have strengthened
our talent pool across the organiza-
tion, and, by no means least, we
have embedded our vision of
Performance with Purpose into all
of our actions and practices.
That is what we have achieved so
far, and it is considerable. We are
an exciting company with a strong
foundation and track record. But
as I look forward into 2013 and
beyond, it is clear that we still have
further to go on our journey. Our
transformation must continue.
The Environment in
Which We Operate
Over the past several years, a
number of forces have combined
to radically reshape the external
environment in which the food and
beverage industry operates. These
changes have had a major impact
on where and how companies must
compete to survive and thrive. Global
macroeconomic growth has slowed
signicantly, and the outlook remains
mixed, particularly in developed
markets. Global economic power
is becoming more distributed, with
the East becoming a larger player in
the world. The demographic equa-
tion in the West is shifting, with an
increasing share of consumption in
the hands of boomers, women and
smaller households, and rapid growth
of diverse ethnic and immigrant com-
munities across countries.
Intensifying consumer and govern-
ment focus on health and wellness
is changing the relative growth
trajectory of our categories and
products. Consumers are clearly
changing their habits, preferences
and consumption patterns. Food
safety and security are now front
and center in the minds of govern-
ments and consumers, increasing
the need for robust systems within
companies to ensure ingredient
and product traceability. Sustained
commodity price increases and
volatility have challenged company
cost structures. Meanwhile, there is
a strong and growing environmental
consciousness emerging in societies
around the world as the focus on
water use, waste disposal (espe-
cially of plastic) and energy use by
industry receives additional scrutiny.
Lastly, the global retail environ-
ment is transforming. In emerg-
ing and developing markets, the
growth of organized modern trade
is beginning to slowly replace tradi-
tional mom and pop stores, and in
developed markets, new discount
channels like hard discounters and
dollar stores are rapidly growing.
Additionally, online retailing is
beginning to make inroads into
our categories while social media
amplies positive messages and
rumors in the blink of an eye.
The combination of these shifts has
put considerable pressure on the