Pepsi 2012 Annual Report Download - page 13
Download and view the complete annual report
Please find page 13 of the 2012 Pepsi annual report below. You can navigate through the pages in the report by either clicking on the pages listed below, or by using the keyword search tool below to find specific information within the annual report.-
 1
1 -
2
-
 3
3 -
 4
4 -
 5
5 -
 6
6 -
 7
7 -
 8
8 -
 9
9 -
 10
10 -
 11
11 -
 12
12 -
 13
13 -
 14
14 -
 15
15 -
 16
16 -
 17
17 -
 18
18 -
 19
19 -
 20
20 -
 21
21 -
 22
22 -
 23
23 -
24
-
25
-
26
-
27
-
28
-
29
-
30
-
31
-
32
-
33
-
34
-
35
-
36
-
37
-
38
-
39
-
40
-
41
-
42
-
43
-
44
-
45
-
46
-
47
-
48
-
49
-
50
-
51
-
52
-
53
-
54
-
55
-
56
-
57
-
58
-
59
-
60
-
61
-
62
-
63
-
64
-
65
-
66
-
67
-
68
-
69
-
70
-
71
-
72
-
73
-
74
-
75
-
76
-
77
-
78
-
79
-
80
-
81
-
82
-
83
-
84
-
85
-
86
-
87
-
88
-
89
-
90
-
91
-
92
-
93
-
94
-
95
-
96
-
97
-
98
-
99
-
100
-
101
-
102
-
103
-
104
-
105
-
106
-
107
-
108
-
109
-
110
-
111
-
112
-
113
-
114
 |
 |

Summary of Operations 2012 2011 Chg (a)
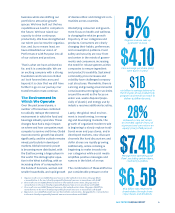
Core net revenue (b) $65,492 $65,881 -1%
Core division operating prot (c) $10,844 $11,329 -4%
Core total operating prot (d) $9,682 $10,368 -7%
Core net income attributable to PepsiCo (e) $6,454 $7,035 -8%
Core earnings per share attributable to PepsiCo (e) $4.10 $4.40 -7%
Other Data
Management operating cash ow, excluding
certain items (f) $7,387 $6,145 20%
Net cash provided by operating activities $8,479 $8,944 -5%
Capital spending $2,714 $3,339 -19%
Common share repurchases $3,219 $2,489 29%
Dividends paid $3,305 $3,157 5%
Long-term debt $23,544 $20,568 14%
PepsiCo, Inc. and Subsidiaries
(In millions except per share data; all per share amounts assume dilution)
(a) Percentage changes are based on unrounded amounts.
(b) In 2011, excludes the impact of an extra reporting week. See page 106 “Reconciliation of GAAP and
Non-GAAP Information” for a reconciliation to the most directly comparable nancial measure in
accordance with GAAP.
(c) Excludes corporate unallocated expenses, merger and integration charges and restructuring and
impairment charges in both years. In 2012, also excludes restructuring and other charges related
to the transaction with Tingyi. In 2011, also excludes certain inventory fair value adjustments in
connection with our Wimm-Bill-Dann (WBD) and bottling acquisitions and the impact of an
extra reporting week. See page 106 “Reconciliation of GAAP and Non-GAAP Information” for a
reconciliation to the most directly comparable nancial measure in accordance with GAAP.
(d) Excludes merger and integration charges, restructuring and impairment charges and the net mark-
to-market impact of our commodity hedges in both years. In 2012, also excludes restructuring and
other charges related to the transaction with Tingyi and a pension lump sum settlement charge. In
2011, also excludes certain inventory fair value adjustments in connection with our WBD and bottling
acquisitions and the impact of an extra reporting week. See page 106 “Reconciliation of GAAP and
Non-GAAP Information” for a reconciliation to the most directly comparable nancial measure in
accordance with GAAP.
(e) Excludes merger and integration charges, restructuring and impairment charges and the net mark-
to-market impact of our commodity hedges in both years. In 2012, also excludes restructuring and
other charges related to the transaction with Tingyi, a pension lump sum settlement charge and tax
benet related to tax court decision. In 2011, also excludes certain inventory fair value adjustments
in connection with our WBD and bottling acquisitions and the impact of an extra reporting week.
See pages 58 and 106 “Results of Operations – Consolidated Review” in Management’s Discussion
and Analysis and “Reconciliation of GAAP and Non-GAAP Information” for reconciliations to the
most directly comparable nancial measures in accordance with GAAP.
(f) Includes the impact of net capital spending, and excludes discretionary pension and retiree medical
payments, merger and integration payments, restructuring payments and capital expenditures
related to the integration of our bottlers in both years. In 2012, also excludes capital expenditures
related to the Productivity Plan and payments for restructuring and other charges related to the
transaction with Tingyi. See also “Our Liquidity and Capital Resources” in Management’s Discussion
and Analysis. See page 107 “Reconciliation of GAAP and Non-GAAP Information” for a reconciliation
to the most directly comparable nancial measure in accordance with GAAP.
“ The actions
we took in
2012 were all
designed to
take us one step
further on the
transformation
journey of our
company.”
Indra K. Nooyi
PepsiCo Chairman and
Chief Executive Officer
2012 PEPSICO ANNUAL REPORT 11