Pepsi 2012 Annual Report Download
Download and view the complete annual report
Please find the complete 2012 Pepsi annual report below. You can navigate through the pages in the report by either clicking on the pages
listed below, or by using the keyword search tool below to find specific information within the annual report.
-
1
-
2
-
3
-
4
-
5
-
6
-
7
-

8
-

9
-
10
-
11
-

12
-
13
-
14
-
15
-
16
-
17
-
18
-
19
-
20
-
21
-
22
-
23
-
24
-
25
-
26
-
27
-
28
-
29
-
30
-
31
-
32
-
33
-
34
-
35
-
36
-
37
-
38
-
39
-
40
-
41
-
42
-
43
-
44
-
45
-
46
-
47
-
48
-
49
-
50
-
51
-
52
-
53
-
54
-
55
-
56
-
57
-
58
-
59
-
60
-
61
-
62
-
63
-
64
-
65
-
66
-
67
-
68
-
69
-
70
-
71
-
72
-
73
-
74
-
75
-
76
-
77
-
78
-
79
-
80
-
81
-
82
-
83
-
84
-
85
-
86
-
87
-
88
-
89
-
90
-
91
-
92
-
93
-
94
-
95
-
96
-
97
-
98
-
99
-
100
-
101
-
102
-
103
-
104
-
105
-
106
-
107
-
108
-
109
-
110
-
111
-
112
-
113
-
114
Table of contents
-
Page 1
-
Page 2
-
Page 3
... 18
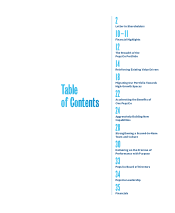
Letter to Shareholders
Financial Highlights
The Breadth of the PepsiCo Portfolio
Reinforcing Existing Value Drivers
Table of Contents
Migrating Our Portfolio Towards High-Growth Spaces
22
Accelerating the Benefits of One PepsiCo
24
Aggressively Building New Capabilities
28
Strengthening...
-
Page 4
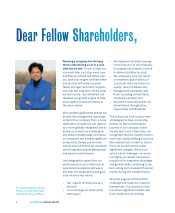
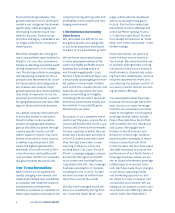
... we did in 2012-we refreshed and refueled our growth engine to help drive superior financial returns in the years ahead. We invested significantly behind our brands. We changed the operating model of our company from a loose federation of countries and regions to a more globally integrated one to...
-
Page 5
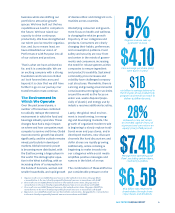
...for a reconciliation to the most directly comparable financial measure in accordance with GAAP.
$7.4B $6.5B
Management operating cash flow4, excluding certain items, reached $7.4 billion. $6.5 billion was returned to shareholders through share repurchases and dividends.
2012 PEPSICO ANNUAL REPORT 3
-
Page 6
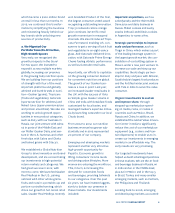
... in key markets also present major growth opportunities. Other potential new areas of expansion for us are premium-priced products, products for aging populations and value offerings for those with lower incomes. As a global company with positions in every key market in the world, PepsiCo's sheer...
-
Page 7
...grains with Stacy's. We established a Global Nutrition Group to drive innovation and brand development, and are concentrating our investments in high-potential return markets and categories. We had great success in 2012, with more to come. We launched Quaker Real Medleys in the U.S., pairing oatmeal...
-
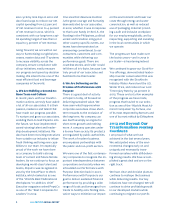
Page 8
...of our net revenue. And over the long term, we are looking to grow our business in these markets at high single digits to low double digits. 3. We Accelerated the Benefits of One PepsiCo PepsiCo's strength lies in the fact that our portfolio is diverse, but related. The convenient snack and beverage...
-
Page 9
... to drive innovation. In 2012, for the first time in PepsiCo, we created a design capability in the company. Our goal is to use design in the early stages of innovation efforts to create memorable products and experiences for our consumers. We also have put in place a common stage-gate process to...
-
Page 10
... of the long term. No company can see itself as simply an engine for short-term growth and nothing more. A company operates under a license from society. Its products are regulated by public authorities. The work of modern business encompasses partnerships with the public and non-profit sectors. We...
-
Page 11
... to managing the company for sustainable long-term performance, respecting and acting on the interdependence of corporations and the societies in which we operate. This is the very essence of Performance with Purpose. I believe it is important now more than ever.
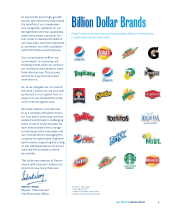
Billion Dollar Brands
PepsiCo has...
-
Page 12
... Beverages PepsiCo Americas Foods
10% 20% 33% 37%
33%
Division Operating Profit
13%
U.S.
7%
51% 49%
Outside U.S.
28%
52%
PepsiCo AMEA PepsiCo Europe PepsiCo Americas Beverages PepsiCo Americas Foods
7% 13% 28% 52%
Cumulative Total Shareholder Return
Return on PepsiCo stock investment...
-
Page 13
... profit (d) Core net income attributable to PepsiCo (e) Core earnings per share attributable to PepsiCo (e) Other Data Management operating cash flow, excluding certain items (f) Net cash provided by operating activities Capital spending Common share repurchases Dividends paid Long-term debt
2012...
-
Page 14
... are beloved the world over as well as offerings that are regional favorites.
Better-for-You
Among the foods and beverages in our Better-for-You portfolio are snacks baked with lower fat content, snacks with whole grains, and beverages with fewer or zero calories and less added sugar.
Good-for-You...
-
Page 15
2012 PEPSICO ANNUAL REPORT
13
-
Page 16
... in 2011, exceeding growth targets. We are extremely proud that our Walkers business was named "Branded Supplier of the Year" at the U.K.'s Grocer Gold Awards. The judging panel for the awards, which recognize strong performance and outstanding customer service, included key PepsiCo retail customers...
-
Page 17
...snack food brand in the world.
With bold and unique flavors, Doritos is the world's leading corn snack.
A cheesy crunch to lighten up the day, Cheetos is the global leader in its category.
SunChips are tasty multigrain snacks that provide 18 grams of whole grains in a one ounce bag.
2012 PEPSICO...
-
Page 18
... with choices that include Pepsi, Pepsi NEXT, Pepsi MAX and Diet Pepsi.
Sierra Mist, our delicious lemon-lime carbonated soft drink in the U.S., is among our 22 billion-dollar brands.
16 2012 PEPSICO ANNUAL REPORT
How We DEW: Mountain Dew is the #1 flavored carbonated soft drink in measured...
-
Page 19
... double-digit retail sales growth in 2012. Importantly, we offer low- or zero-calorie and smaller-portioned options, such as 8 ounce cans (pictured below), for almost every drink we make. To further help our consumers manage calories, we are keenly focused on innovation. In 2012, we launched Pepsi...
-
Page 20
... the nutrition space are global, as illustrated by the progress of our Quaker business. Last year, we increased Quaker retail sales in the U.K. with the success of Oats So Simple, grew Quaker volume in China and India with breakfast foods customized for local tastes, and leveraged Quaker's expertise...
-
Page 21
... U.S. and the 2013 launch of Trop 50 in the U.K.
Gatorade, the clear leader in the sports nutrition category, is poised to continue its global expansion in 2013.
Naked Juice is one of our strongest growth performers and in 2012, grew net revenue 21 percent over 2011.
2012 PEPSICO ANNUAL REPORT 19
-
Page 22
... 2012 PEPSICO ANNUAL REPORT
We continue to build on our leading position in Russia, with global brands such as Lay's, Pepsi and 7UP. Our strong local brands include Chudo (dairy and grains), Fruktovy Sad (juices and juice drinks) and Hrusteam (bread snacks).
1 Organic results are non-GAAP financial...
-
Page 23
...'s largest beverage market by 2015. Our strategic beverage alliance with Tingyi gives us a competitive advantage in this market. Our iconic beverage brands, including Pepsi, Mirinda, Gatorade and Tropicana, are now brought to Chinese consumers through the PepsiCo-Tingyi beverage system. Last year...
-
Page 24
... of our portfolio in the market. The benefits derived from their continued integration are seen in the top- and bottomline growth delivered by our Russia business in 2012. Our juice business in Russia leads the market with brands such as Fruktovy Sad (pictured below).
22
2012 PEPSICO ANNUAL REPORT
-
Page 25
... new product launch in Taco Bell history, would not have been possible without the strong partnership we have with PepsiCo."
Greg Creed Chief Executive Officer, Taco Bell
In 2012, we partnered with Taco Bell to introduce Doritos Locos Tacos, the restaurant's biggest success in its 50-year history...
-
Page 26
...; in snacks, Lay's, Doritos, Cheetos and SunChips; and in our nutrition business, Quaker, Tropicana and Gatorade. We launched bold new brand positioning with our global Pepsi "Live for Now" campaign and fresh Tropicana messaging in North America and Europe; upped our game in digital marketing with...
-
Page 27
...content
for Pepsi consumers. As we launch "Live for Now" around the world, we are customizing it for our local markets, while staying true to the brand position of living in the moment. In the Middle East, the campaign is called "Yalla Now" and in India, "Oh Yes Abhi."
2012 PEPSICO ANNUAL REPORT 25
-
Page 28
... growth. Innovation from products launched in the past three years accounted for approximately eight percent of our net revenue in 2012.
26 2012 PEPSICO ANNUAL REPORT
Innovation enables us to meet growing consumer demand for tasty and convenient nutrition with Good-for-You choices such as Quaker...
-
Page 29
... a leading role in our global research and innovation focused on fruits and vegetables. In 2013, we will inaugurate our Global Baking Innovation and Nutrition Center. Located in Monterrey, Mexico, it will focus on baked snacks innovation that can be adapted globally.
2012 PEPSICO ANNUAL REPORT
27
-
Page 30
... customs while enabling women to work and advance. Our Saudi team includes 25 women hired in 2011 and 2012 in both management and front-line roles.
TAkING A STAND fOR EqUALITy
As a global company, PepsiCo works in countries with a broad array of laws and regulations. Regardless of where we operate...
-
Page 31
... thousands of eligible companies make the Top 100 ranking. On the 2013 list, PepsiCo is the only food and beverage company in the top 50.
CREATING OPPORTUNITIES fOR DIffERENTLy-ABLED PEOPLE
Our PepsiCo Mexico Foods as well as our Middle East business exemplify how PepsiCo creates opportunities for...
-
Page 32
... goal to improve global operational water-use efficiency by 20 percent per unit of production four years ahead of schedule. We also met our goal to provide access to safe water to three million people in 2012-three years ahead of plan- through the efforts of the PepsiCo Foundation. In recognition...
-
Page 33
...our Lost Time Injury Rate by 32 percent compared to 2011.
Low- or zero-calorie beverages, active hydration offerings and juices collectively comprised 49 percent of our 2012 U.S. beverage volume.
49% 20%
350
We achieved our goal-four years ahead of schedule-to improve global operational water-use...
-
Page 34
32
2012 PEPSICO ANNUAL REPORT
-
Page 35
...1996.
James J. Schiro Former Chief Executive Officer, Zurich Financial Services 67. Elected 2003. Shona L. Brown Senior Advisor, Google Inc. 47. Elected 2009. George W. Buckley Chairman, Arle Capital LLP 66. Elected 2012. Lloyd G. Trotter Managing Partner, GenNx360 Capital Partners 67. Elected 2008...
-
Page 36
...North America Enderson Guimaraes Chief Executive Officer, PepsiCo Europe Hugh f. Johnston Executive Vice President and Chief Financial Officer, PepsiCo Mehmood khan Executive Vice President, PepsiCo Chief Scientific Officer, Global Research and Development Indra k. Nooyi Chairman and Chief Executive...
-
Page 37
... Pension and Retiree Medical Plans Our Financial Results Items Affecting Comparability Results of Operations - Consolidated Review Results of Operations - Division Review Frito-Lay North America Quaker Foods North America Latin America Foods PepsiCo Americas Beverages Europe Asia, Middle East...
-
Page 38
... and financial condition. These indicators include market share, volume, net revenue, operating profit, management operating cash flow, earnings per share and return on invested capital. During 2012 we undertook a number of significant initiatives that we believe will position us for future success...
-
Page 39
... of our marketing and innovation teams across the Company. We plan to increase the use of global marketing campaigns for our iconic global brands, such as the "Live for Now" campaign for Pepsi to create a more consistent brand experience for consumers around the world. We also expect to continue...
-
Page 40
... consolidated financial statements for additional information about our acquisitions of WBD in 2011 and PBG and PAS in 2010. Asia, Middle East and Africa Either independently or in conjunction with third-party partners, AMEA makes, markets, sells and distributes a number of leading snack food brands...
-
Page 41
... sales to our independent bottlers which were used in finished goods sold by them to these retailers.
Our Competition Our businesses operate in highly competitive markets. Our beverage, snack and food brands compete against global, regional, local and private label manufacturers and other value...
-
Page 42
...we are unable to innovate or market our products effectively. We are a global food and beverage company operating in highly competitive categories and rely on continued demand for our products. To generate revenues and profits, we must sell products that appeal to our customers and to consumers. Any...
-
Page 43
... effectively execute advertising campaigns and marketing programs. In addition, both the launch and ongoing success of new products and advertising campaigns are inherently uncertain, especially as to their appeal to consumers. Our failure to make the right strategic investments to drive innovation...
-
Page 44
...China,
42 2012 PEPSICO ANNUAL REPORT
India, Brazil and the Africa and Middle East regions, present important future growth opportunities for us. However, there can be no assurance that our existing products, variants of our existing products or new products that we make, manufacture, market or sell...
-
Page 45
... business, financial condition and results of operations. We are implementing a strategic plan that we believe will position our business for future success and growth, to allow us to achieve a lower cost structure and operate efficiently in the highly competitive food, snack and beverage industries...
-
Page 46
Management's Discussion and Analysis
to lead and execute our plan. Our future success and earnings growth depends in part on our ability to reduce costs and improve efficiencies. If we are unable to successfully implement our productivity plan or fail to implement it as timely as we anticipate, our...
-
Page 47
... support activities and information technology systems between our Company and the acquired company and successfully operating in new categories; motivating, recruiting and retaining executives and key employees; conforming standards, controls (including internal control over financial reporting...
-
Page 48
... in exchange rates may have an adverse impact on our business results or financial condition. We hold assets and incur liabilities, earn revenues and pay expenses in a variety of currencies other than the U.S. dollar. Because our consolidated financial statements are presented in U.S. dollars, the...
-
Page 49
... could have a material adverse effect on our business, financial condition and results of operations." Market Risks We are exposed to market risks arising from adverse changes in: • commodity prices, affecting the cost of our raw materials and energy; • foreign exchange rates and currency...
-
Page 50
... potential change in fair value of commodity derivative instruments, assuming a 10% decrease in the underlying commodity price, would have increased our net losses in 2012 by $85 million. Foreign Exchange Financial statements of foreign subsidiaries are translated into U.S. dollars using period-end...
-
Page 51
...were $8.1 billion and $8.3 billion, respectively. Assuming year-end 2012 variable rate debt and investment levels, a 1-percentage-point increase in interest rates would have increased net interest expense by $9 million in 2012. Risk Management Framework The achievement of our strategic and operating...
-
Page 52
..., product life cycles, market share, consumer awareness, brand history and future expansion expectations, amount and timing of future cash flows and the discount rate applied to the cash flows. We believe that a brand has an indefinite life if it has a history of strong revenue and cash flow...
-
Page 53
Management's Discussion and Analysis
which are inputs from our annual long-range planning process. Additionally, they are also impacted by estimates of discount rates, perpetuity growth assumptions and other factors. If the book value of a reporting unit exceeds its fair value, we complete the ...
-
Page 54
... expected return on assets in our funded plans; • for pension expense, the rate of salary increases for plans where benefits are based on earnings; and • for retiree medical expense, health care cost trend rates.
Our assumptions reflect our historical experience and management's best judgment...
-
Page 55
..., plan design, new medical technologies and changes in medical carriers. Weighted-average assumptions for pension and retiree medical expense are as follows:
2013 Pension Expense discount rate Expected rate of return on plan assets Expected rate of salary increases Retiree medical Expense discount...
-
Page 56
... Tingyi Pension lump sum settlement charge Tax benefit related to tax court decision 53rd week Inventory fair value adjustments Gain on previously held equity interests Venezuela currency devaluation Asset write-off Foundation contribution Debt repurchase
54 2012 PEPSICO ANNUAL REPORT
2011 $ 623...
-
Page 57
... our complementary food, snack and beverage businesses by leveraging new technologies and processes across PepsiCo's operations, goto-market and information systems; heightening the focus on best practice sharing across the globe; consolidating manufacturing, warehouse and sales facilities; and...
-
Page 58
... GAAP reporting measures. See also "Organic Revenue Growth" and "Management Operating Cash Flow."
Results of Operations - Consolidated Review In the discussions of net revenue and operating profit below, "effective net pricing" reflects the year-over-year impact of discrete pricing actions, sales...
-
Page 59
...the net revenue growth, partially offset by higher commodity costs. Items affecting comparability (see "Items Affecting Comparability") contributed 10 percentage points to the total operating profit growth and 1.2 percentage points to the total operating margin increase.
2012 PEPSICO ANNUAL REPORT...
-
Page 60
...higher average debt balances in 2011. The tax rate increased 3.8 percentage points compared to 2010, primarily reflecting the prior year non-taxable gain and reversal of deferred taxes attributable to our previously held equity interests in connection with our acquisitions of PBG and PAS. Net income...
-
Page 61
... our results and related information regarding non-GAAP measures.
FLNA Net Revenue, 2012 Net Revenue, 2011 % Impact of: Volume(a) Effective net pricing(b) Foreign exchange translation Acquisitions and divestitures Reported growth(c) (1)% 3 - - 2% FLNA Net Revenue, 2011 Net Revenue, 2010 % Impact...
-
Page 62
... driven by the net revenue growth and planned cost reductions across a number of expense categories, partially offset by higher commodity costs, primarily cooking oil, which reduced operating profit growth by 6 percentage points, and higher advertising and marketing
60
2012 PEPSICO ANNUAL REPORT
-
Page 63
...business and the sale of a distribution center increased operating profit growth by 4 percentage points, and a change in accounting methodology for inventory contributed 2 percentage points to operating profit growth (see Note 1 to our consolidated financial statements).
2012 PEPSICO ANNUAL REPORT...
-
Page 64
...by higher commodity costs. Acquisitions and divestitures, which included a gain from the sale of a fish business in Brazil, contributed nearly 4 percentage points to operating profit growth. Restructuring charges reduced operating profit growth by 5 percentage points.
62
2012 PEPSICO ANNUAL REPORT
-
Page 65
... point to the operating profit decline. 2011 Net revenue increased 10%, primarily reflecting the incremental finished goods revenue related to our acquisitions of PBG and PAS. Favorable foreign exchange contributed nearly 1 percentage point to net revenue growth and the 53rd week contributed...
-
Page 66
... Mexico beverage business in the fourth quarter contributed 1 percentage point to reported operating profit growth and included a one-time
gain associated with the contribution of this business to form a joint venture with both Cultiba and Empresas Polar.
Europe
% Change 2012 Net revenue 53rd week...
-
Page 67
... effective net pricing. Foreign exchange contributed 2 percentage points to net revenue growth. Acquisitions had a nominal impact on net revenue growth. Snacks volume grew 15%, reflecting broad-based increases driven by double-digit growth in India, China and the Middle East. Beverage volume...
-
Page 68
... long-term debt of $3.6 billion and stock option proceeds of $1.1 billion. During 2011, net cash used for financing activities was $5.1 billion, primarily reflecting the return of operating cash flow to our shareholders through share repurchases and dividend payments of $5.6 billion, our purchase...
-
Page 69
... cash flow was used primarily to repurchase shares and pay dividends. We expect to continue to return management operating cash flow to our shareholders through dividends and share repurchases while maintaining credit ratings that provide us with ready access to global and capital credit markets...
-
Page 70
Consolidated Statement of Income
Fiscal years ended December 29, 2012, December 31, 2011 and December 25, 2010 (in millions except per share amounts) Net Revenue Cost of sales Selling, general and administrative expenses Amortization of intangible assets Operating Profit Bottling equity income ...
-
Page 71
...to PepsiCo 2010 Pre-tax amounts Net income Other Comprehensive Income Currency translation adjustment Cash flow hedges: Net derivative losses Reclassification of net losses to net income Pension and retiree medical: Net prior service credit Net losses Unrealized gains on securities Other Total Other...
-
Page 72
...-off Non-cash foreign exchange loss related to Venezuela devaluation Excess tax benefits from share-based payment arrangements Pension and retiree medical plan contributions Pension and retiree medical plan expenses Bottling equity income, net of dividends Deferred income taxes and other tax charges...
-
Page 73
... Effect of exchange rate changes on cash and cash equivalents Net Increase/(Decrease) in Cash and Cash Equivalents Cash and Cash Equivalents, Beginning of Year Cash and Cash Equivalents, End of Year Non-cash activity: Issuance of common stock and equity awards in connection with our acquisitions...
-
Page 74
... Liabilities Long-Term Debt Obligations Other Liabilities Deferred Income Taxes Total Liabilities Commitments and Contingencies Preferred Stock, no par value Repurchased Preferred Stock PepsiCo Common Shareholders' Equity Common stock, par value 1 per share (authorized 3,600 shares, issued, net...
-
Page 75
...: Net pension and retiree medical losses Reclassification of net losses to net income Unrealized gains/(losses) on securities, net of tax Other Balance, end of year Repurchased Common Stock Balance, beginning of year Share repurchases Stock option exercises Other Balance, end of year Total PepsiCo...
-
Page 76
...change on previously issued financial statements was not considered material. Raw materials, direct labor and plant overhead, as well as purchasing and receiving costs, costs directly related to production planning, inspection costs and raw material handling facilities, are included in cost of sales...
-
Page 77
... the total service costs determined using the plans' discount rates as disclosed in Note 7 to our consolidated financial statements. Derivatives We centrally manage commodity derivatives on behalf of our divisions. These commodity derivatives include agricultural products, metals and energy. Certain...
-
Page 78
... 973 517 610 3,033 220 - $ 3,253
(a) Changes in total assets in 2011 relate primarily to our acquisition of WBD. (b) Corporate assets consist principally of cash and cash equivalents, short-term investments, derivative instruments and property, plant and equipment.
76
2012 PEPSICO ANNUAL REPORT
-
Page 79
... the country where they are primarily used. (b) Change in 2011 relates primarily to our acquisition of WBD.
Net Revenue Other
Long-Lived Assets Other Brazil United Kingdom Canada Mexico Russia
Brazil United Kingdom Canada Mexico Russia
United States
United States
2012 PEPSICO ANNUAL REPORT
77
-
Page 80
... out-of-date products. For additional unaudited information on our revenue recognition and related policies, including our policy on bad debts, see "Our Critical Accounting Policies" in Management's Discussion and Analysis. We are exposed to concentration of credit risk by our customers, including...
-
Page 81
... Accounting Policies" in Management's Discussion and Analysis. • Income Taxes - Note 5, and for additional unaudited information see "Our Critical Accounting Policies" in Management's Discussion and Analysis. • Stock-Based Compensation - Note 6. • Pension, Retiree Medical and Savings Plans...
-
Page 82
... our complementary food, snack and beverage businesses by leveraging new technologies and processes across PepsiCo's operations; go-to-market and information systems; heightening the focus on best practice sharing across the globe; consolidating manufacturing, warehouse and sales facilities; and...
-
Page 83
... to Consolidated Financial Statements
A summary of our Productivity Plan activity in 2011 and 2012 was as follows:
Severance and Other Asset Employee Costs Impairments Other Costs
Total
2011 restructuring charges Cash payments Non-cash charges Liability as of December 31, 2011 2012 restructuring...
-
Page 84
... assets as of December 29, 2012 and using average 2012 foreign exchange rates, is expected to be as follows:
2013 Five-year projected amortization $110 2014 $95 2015 $86 2016 $78 2017 $72
Depreciable and amortizable assets are only evaluated for impairment upon a significant change in the operating...
-
Page 85
...Brands 690 169 859 Total goodwill Total reacquired franchise rights Total acquired franchise rights Total brands Total other 14,661 8,076 1,792 1,905 10 $ 26,444
(a) Net increase in 2011 relates primarily to our acquisition of WBD.
Translation and Other $ (2) (1) (3) -
Balance, End of Acquisitions...
-
Page 86
... Stock-based compensation Retiree medical benefits Other employee-related benefits Pension benefits Deductible state tax and interest benefits Long-term debt obligations acquired Other Gross deferred tax assets Valuation allowances Deferred tax assets, net Net deferred tax liabilities Deferred taxes...
-
Page 87
... impairment (benefits)/charges Total(a) Income tax benefits recognized in earnings related to stock-based compensation $278 2 (7) $273 $ 73 2011 $326 13 4 $343 $101 2010 $299 53 - $352 $ 89
Carryforwards and Allowances Operating loss carryforwards totaling $10.4 billion at year-end 2012 are being...
-
Page 88
... over the expected life based on our stated dividend policy and forecasts of net income, share repurchases and stock price. A summary of our stock-based compensation activity for the year ended December 29, 2012 is presented below:
Options(a) Outstanding at December 31, 2011 Granted Exercised...
-
Page 89
... based upon the average remaining service period of active plan participants, which is approximately 11 years for pension expense and approximately 8 years for retiree medical expense. The cost or benefit of plan changes that increase or decrease benefits for
2012 PEPSICO ANNUAL REPORT 87
$
6.86...
-
Page 90
... in retiree medical expenses. In the fourth quarter of 2012, the Company offered certain former employees who have vested benefits in our defined benefit pension plans the option of receiving a one-time lump sum payment equal to the present value of the participant's pension benefit (payable in cash...
-
Page 91
... in discount rate Employee-related assumption changes Liability-related experience different from assumptions Actual asset return different from expected return Amortization and settlement of losses Other, including foreign currency adjustments Total Liability at end of year for service to date...
-
Page 92
...average assumptions used to determine projected benefit liability and benefit expense for our pension and retiree medical plans:
Pension U.S. 2012 Weighted-average assumptions Liability discount rate Expense discount rate Expected return on plan assets Liability rate of salary increases Expense rate...
-
Page 93
... to Consolidated Financial Statements
Plan Assets
Pension Our pension plan investment strategy includes the use of actively managed securities and is reviewed periodically in conjunction with plan liabilities, an evaluation of market conditions, tolerance for risk and cash requirements for benefit...
-
Page 94
... is as follows:
Balance, End of 2011 Real estate commingled funds Contracts with insurance companies Total $ 56 54 $110 Return on Assets Held at Year End $15 9 $24 Return on Assets Sold $1 - $1 Purchases and Sales, Net $319 (1) $318 Balance, End of 2012 $391 62 $453
92
2012 PEPSICO ANNUAL REPORT
-
Page 95
... our share of retiree medical costs limits the impact. In addition, as of January 1, 2011, the Company started phasing out Company subsidies of retiree medical benefits. A 1-percentage-point change in the assumed health care trend rate would have the following effects:
1% Increase 2012 Service and...
-
Page 96
... course of business. See Note 8 to our consolidated financial statements regarding contracts related to certain of our bottlers. See "Our Liquidity and Capital Resources" in Management's Discussion and Analysis for further unaudited information on our borrowings.
94
2012 PEPSICO ANNUAL REPORT
-
Page 97
...the cost of our raw materials and energy; • foreign exchange risks and currency restrictions; and • interest rates. In the normal course of business, we manage these risks through a variety of strategies, including the use of derivatives. Certain derivatives are designated as either cash flow or...
-
Page 98
...-for-sale securities(b) $ 79 $161 $ 33 $ - Short-term investments - index funds(c) Prepaid forward contracts(d) Deferred compensation(e) Derivatives designated as fair value hedging instruments: Interest rate derivatives(f) Derivatives designated as cash flow hedging instruments: Foreign exchange...
-
Page 99
...income available for PepsiCo common shareholders Dilutive securities: Stock options and RSUs Employee Stock Ownership Plan (ESOP) convertible preferred stock Diluted Diluted net income attributable to PepsiCo per common share
(a) Weighted-average common shares outstanding (in millions).
2011 Shares...
-
Page 100
... PepsiCo were as follows:
2012 Currency translation adjustment Cash flow hedges, net of tax Unamortized pension and retiree medical, net of tax(a) Unrealized gain on securities, net of tax Other Accumulated other comprehensive loss attributable to PepsiCo $(1,946) (94) (3,491) 80 (36) $(5,487) 2011...
-
Page 101
...'s outstanding ordinary shares, pursuant to the purchase agreement dated December 1, 2010 between PepsiCo and certain selling shareholders of WBD for approximately $3.8 billion in cash (or $2.4 billion, net of cash and cash equivalents acquired). The acquisition of those shares
increased our total...
-
Page 102
... for many years. The management of PepsiCo is responsible for the objectivity and integrity of our consolidated financial statements. The Audit Committee of the Board of Directors has engaged independent registered public accounting firm, KPMG LLP, to audit our consolidated financial statements, and...
-
Page 103
... internal control over financial reporting, as such term is defined in Rule 13a-15(f) of the Exchange Act. Under the supervision and with the participation of our management, including our Chief Executive Officer and Chief Financial Officer, we conducted an evaluation of the effectiveness of our...
-
Page 104
... December 29, 2012 and December 31, 2011, and the related Consolidated Statements of Income, Comprehensive Income, Cash Flows and Equity for each of the fiscal years in the three-year period ended December 29, 2012. We also have audited PepsiCo, Inc.'s internal control over financial reporting as of...
-
Page 105
...date and hedging contracts included in PBG's and PAS's balance sheets at the acquisition date. See Note 15 to our consolidated financial statements. ( i ) Represents the composite high and low sales price and quarterly closing prices for one share of PepsiCo common stock.
2012 PEPSICO ANNUAL REPORT...
-
Page 106
Five-Year Summary (unaudited)
2012 Net revenue Net income attributable to PepsiCo Net income attributable to PepsiCo per common share - basic Net income attributable to PepsiCo per common share - diluted Cash dividends declared per common share Total assets Long-term debt Return on invested capital...
-
Page 107
... our complementary food, snack and beverage businesses by leveraging new technologies and processes across PepsiCo's operations, go-to-market and information systems; heightening the focus on best practice sharing across the globe; consolidating manufacturing, warehouse and sales facilities; and...
-
Page 108
...0.08 (0.14) - - $ 4.10
- - - (0.04) 0.02 $ 4.40 (7)%
Pension Lump Sum Settlement Charge Tax Benefit Related to Tax Court Decision
Total Operating Profit Reconciliation
Year Ended 12/29/12 12/31/11 Reported Operating Profit Mark-to-Market Net Impact Merger and Integration Charges Restructuring and...
-
Page 109
...
Year Ended 12/29/12 12/31/11 Net Cash Provided by Operating Activities Capital Spending Sales of Property, Plant and Equipment Management Operating Cash Flow Discretionary Pension and Retiree Medical Contributions (after-tax) Merger and Integration Payments (after-tax) Payments Related...
-
Page 110
...arising from changes in commodity prices, interest rates, foreign exchange rates and stock prices. Direct-Store-Delivery (DSD): delivery system used by us and our independent bottlers to deliver snacks and beverages directly to retail stores where our products are merchandised. Effective net pricing...
-
Page 111
... number.
The closing price for a share of PepsiCo common stock on the New York Stock Exchange was the price as reported by Bloomberg for the years ending 2008- 2012. Past performance is not necessarily indicative of future returns on investments in PepsiCo common stock.
2012 PEPSICO ANNUAL REPORT...
-
Page 112
... deposit of dividends, optional cash investments by electronic funds transfer or check drawn on a U.S. bank, sale of shares, online account access, and electronic delivery of shareholder materials. Financial and Other Information PepsiCo's 2013 quarterly earnings releases are expected to be issued...
-
Page 113
-
Page 114


