PNC Bank 2014 Annual Report Download - page 90
Download and view the complete annual report
Please find page 90 of the 2014 PNC Bank annual report below. You can navigate through the pages in the report by either clicking on the pages listed below, or by using the keyword search tool below to find specific information within the annual report.-
 1
1 -
2
-
3
-
4
-
5
-
6
-
7
-
8
-
9
-
10
-
11
-
12
-
13
-
14
-
15
-
16
-
17
-
18
-
19
-
20
-
21
-
22
-
23
-
24
-
25
-
26
-
27
-
28
-
29
-
30
-
31
-
32
-
33
-
34
-
35
-
36
-
37
-
38
-
39
-
40
-
41
-
42
-
43
-
44
-
45
-
46
-
47
-
48
-
49
-
50
-
51
-
52
-
53
-
54
-
55
-
56
-
57
-
58
-
59
-
60
-
61
-
62
-
63
-
64
-
65
-
66
-
67
-
68
-
69
-
70
-
71
-
72
-
73
-
74
-
75
-
76
-
77
-
78
-
79
-
 80
80 -
 81
81 -
 82
82 -
 83
83 -
 84
84 -
 85
85 -
 86
86 -
 87
87 -
 88
88 -
 89
89 -
 90
90 -
 91
91 -
 92
92 -
 93
93 -
 94
94 -
 95
95 -
 96
96 -
 97
97 -
 98
98 -
 99
99 -
 100
100 -
101
-
102
-
103
-
104
-
105
-
106
-
107
-
108
-
109
-
110
-
111
-
112
-
113
-
114
-
115
-
116
-
117
-
118
-
119
-
120
-
121
-
122
-
123
-
124
-
125
-
126
-
127
-
128
-
129
-
130
-
131
-
132
-
133
-
134
-
135
-
136
-
137
-
138
-
139
-
140
-
141
-
142
-
143
-
144
-
145
-
146
-
147
-
148
-
149
-
150
-
151
-
152
-
153
-
154
-
155
-
156
-
157
-
158
-
159
-
160
-
161
-
162
-
163
-
164
-
165
-
166
-
167
-
168
-
169
-
170
-
171
-
172
-
173
-
174
-
175
-
176
-
177
-
178
-
179
-
180
-
181
-
182
-
183
-
184
-
185
-
186
-
187
-
188
-
189
-
190
-
191
-
192
-
193
-
194
-
195
-
196
-
197
-
198
-
199
-
200
-
201
-
202
-
203
-
204
-
205
-
206
-
207
-
208
-
209
-
210
-
211
-
212
-
213
-
214
-
215
-
216
-
217
-
218
-
219
-
220
-
221
-
222
-
223
-
224
-
225
-
226
-
227
-
228
-
229
-
230
-
231
-
232
-
233
-
234
-
235
-
236
-
237
-
238
-
239
-
240
-
241
-
242
-
243
-
244
-
245
-
246
-
247
-
248
-
249
-
250
-
251
-
252
-
253
-
254
-
255
-
256
-
257
-
258
-
259
-
260
-
261
-
262
-
263
-
264
-
265
-
266
-
267
-
268
 |
 |

Credit Risk Management
Credit risk represents the possibility that a customer,
counterparty or issuer may not perform in accordance with
contractual terms. Credit risk is inherent in the financial
services business and results from extending credit to
customers, purchasing securities, and entering into financial
derivative transactions and certain guarantee contracts. Credit
risk is one of our most significant risks. Our processes for
managing credit risk are embedded in PNC’s risk culture and
in our decision-making processes using a systematic approach
whereby credit risks and related exposures are identified and
assessed, managed through specific policies and processes,
measured and evaluated against our risk appetite and credit
concentration limits, and reported, along with specific
mitigation activities, to management and the Board through
our governance structure.
Asset Quality Overview
Asset quality trends in 2014 improved from 2013.
• Nonperforming assets at December 31, 2014
decreased $577 million compared with December 31,
2013 as a result of improvements in both consumer
and commercial nonperforming loans. Consumer
lending nonperforming loans decreased $224 million,
commercial real estate nonperforming loans declined
$184 million and commercial nonperforming loans
decreased $167 million. Nonperforming assets were
0.83% of total assets at December 31, 2014 compared
with 1.08% at December 31, 2013.
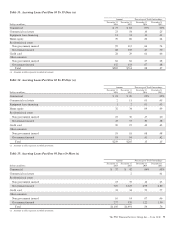
• Overall loan delinquencies of $1.9 billion decreased
$.5 billion, or 22%, from year-end 2013 levels. The
reduction was due in large part to a reduction in
accruing government insured residential real estate
loans past due 90 days or more of $.3 billion, the
majority of which we took possession of and
conveyed the real estate, or are in the process of
conveyance and claim resolution.
• Net charge-offs were $.5 billion in 2014, down 51%
from net charge-offs in 2013 of $1.1 billion, due
primarily to improved overall credit quality. Net
charge-offs for 2013 included $134 million of
charge-offs due to the impact of alignment with
interagency supervisory guidance on practices for
loans and lines of credit related to consumer lending
in the first quarter of 2013.
• Provision for credit losses in 2014 decreased to $273
million compared with $643 million in 2013. The
smaller provision is attributed to improved overall
credit quality, including lower consumer loan
delinquencies, and the increasing value of residential
real estate which resulted in greater expected cash
flows from our purchased impaired loans.
• The level of ALLL decreased to $3.3 billion at
December 31, 2014 from $3.6 billion at
December 31, 2013.
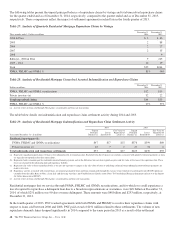
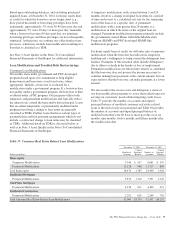
Nonperforming Assets and Loan Delinquencies
Nonperforming Assets, including OREO and Foreclosed Assets
Nonperforming assets include nonperforming loans and leases
for which ultimate collectability of the full amount of
contractual principal and interest is not probable and include
nonperforming troubled debt restructurings (TDRs), OREO
and foreclosed assets. Loans held for sale, certain government
insured or guaranteed loans, purchased impaired loans and
loans accounted for under the fair value option are excluded
from nonperforming loans. Additional information regarding
our nonperforming loans and nonaccrual policies is included
in Note 1 Accounting Policies in the Notes To Consolidated
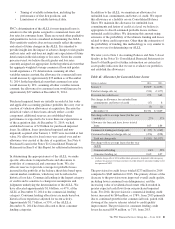
Financial Statements in Item 8 of this Report. The major
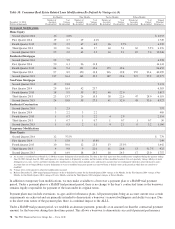
categories of nonperforming assets are presented in Table 30.
In the first quarter of 2013, we completed our alignment of
certain nonaccrual and charge-off policies consistent with
interagency supervisory guidance on practices for loans and
lines of credit related to consumer lending. This alignment
primarily related to (i) subordinate consumer loans (home
equity loans and lines of credit and residential mortgages)
where the first-lien loan was 90 days or more past due,
(ii) government guaranteed loans where the guarantee may not
result in collection of substantially all contractual principal
and interest and (iii) certain loans with borrowers in or
discharged from bankruptcy. In the first quarter of 2013,
nonperforming loans increased by $426 million and net
charge-offs increased by $134 million as a result of
completing the alignment of the aforementioned policies.
Additionally, overall delinquencies decreased $395 million
due to loans now being reported as either nonperforming or, in
the case of loans accounted for under the fair value option,
nonaccruing or having been charged off. Certain consumer
nonperforming loans were charged-off to the respective
collateral value less costs to sell, and any associated allowance
at the time of charge-off was reduced to zero. As the
interagency guidance was adopted, incremental provision for
credit losses was recorded if the related loan charge-off
exceeded the associated allowance. Subsequent declines in
collateral value for these loans will result in additional charge-
offs to maintain recorded investment at collateral value less
costs to sell.
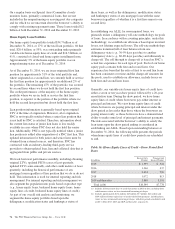
At December 31, 2014, TDRs included in nonperforming
loans were $1.4 billion, or 55%, of total nonperforming loans
compared to $1.5 billion, or 49%, of total nonperforming
loans as of December 31, 2013. Within consumer
nonperforming loans, residential real estate TDRs comprise
60% of total residential real estate nonperforming loans at
December 31, 2014, up from 59% at December 31, 2013.
Home equity TDRs comprise 54% of home equity
nonperforming loans at both December 31, 2014 and at
December 31, 2013. TDRs generally remain in nonperforming
status until a borrower has made at least six consecutive
months of both principal and interest payments under the
modified terms or ultimate resolution occurs. Loans where
borrowers have been discharged from personal liability
72 The PNC Financial Services Group, Inc. – Form 10-K