PNC Bank 2014 Annual Report Download - page 213
Download and view the complete annual report
Please find page 213 of the 2014 PNC Bank annual report below. You can navigate through the pages in the report by either clicking on the pages listed below, or by using the keyword search tool below to find specific information within the annual report.-
 1
1 -
2
-
3
-
4
-
5
-
6
-
7
-
8
-
9
-
10
-
11
-
12
-
13
-
14
-
15
-
16
-
17
-
18
-
19
-
20
-
21
-
22
-
23
-
24
-
25
-
26
-
27
-
28
-
29
-
30
-
31
-
32
-
33
-
34
-
35
-
36
-
37
-
38
-
39
-
40
-
41
-
42
-
43
-
44
-
45
-
46
-
47
-
48
-
49
-
50
-
51
-
52
-
53
-
54
-
55
-
56
-
57
-
58
-
59
-
60
-
61
-
62
-
63
-
64
-
65
-
66
-
67
-
68
-
69
-
70
-
71
-
72
-
73
-
74
-
75
-
76
-
77
-
78
-
79
-
80
-
81
-
82
-
83
-
84
-
85
-
86
-
87
-
88
-
89
-
90
-
91
-
92
-
93
-
94
-
95
-
96
-
97
-
98
-
99
-
100
-
101
-
102
-
103
-
104
-
105
-
106
-
107
-
108
-
109
-
110
-
111
-
112
-
113
-
114
-
115
-
116
-
117
-
118
-
119
-
120
-
121
-
122
-
123
-
124
-
125
-
126
-
127
-
128
-
129
-
130
-
131
-
132
-
133
-
134
-
135
-
136
-
137
-
138
-
139
-
140
-
141
-
142
-
143
-
144
-
145
-
146
-
147
-
148
-
149
-
150
-
151
-
152
-
153
-
154
-
155
-
156
-
157
-
158
-
159
-
160
-
161
-
162
-
163
-
164
-
165
-
166
-
167
-
168
-
169
-
170
-
171
-
172
-
173
-
174
-
175
-
176
-
177
-
178
-
179
-
180
-
181
-
182
-
183
-
184
-
185
-
186
-
187
-
188
-
189
-
190
-
191
-
192
-
193
-
194
-
195
-
196
-
197
-
198
-
199
-
200
-
201
-
202
-
 203
203 -
 204
204 -
 205
205 -
 206
206 -
 207
207 -
 208
208 -
 209
209 -
 210
210 -
 211
211 -
 212
212 -
 213
213 -
 214
214 -
 215
215 -
 216
216 -
 217
217 -
 218
218 -
 219
219 -
 220
220 -
 221
221 -
 222
222 -
 223
223 -
224
-
225
-
226
-
227
-
228
-
229
-
230
-
231
-
232
-
233
-
234
-
235
-
236
-
237
-
238
-
239
-
240
-
241
-
242
-
243
-
244
-
245
-
246
-
247
-
248
-
249
-
250
-
251
-
252
-
253
-
254
-
255
-
256
-
257
-
258
-
259
-
260
-
261
-
262
-
263
-
264
-
265
-
266
-
267
-
268
 |
 |

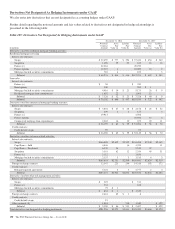
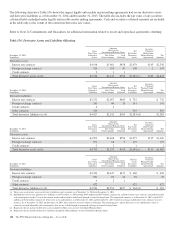
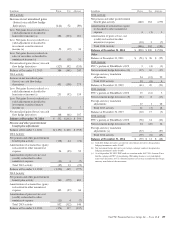
In addition to using master netting and related collateral
agreements to reduce credit risk associated with derivative
instruments, we also seek to manage credit risk by evaluating
credit ratings of counterparties, by taking collateral and by
using internal credit analysis, limits, and monitoring
procedures. Collateral may also be exchanged under certain
derivative agreements that are not considered master netting
agreements.
At December 31, 2014, we held cash, U.S. government
securities and mortgage-backed securities totaling $815
million under master netting and other collateral agreements
to collateralize net derivative assets due from counterparties,
and we have pledged cash totaling $514 million under these
agreements to collateralize net derivative liabilities owed to
counterparties. These totals may differ from the amounts
presented in the preceding offsetting table because they may
include collateral exchanged under an agreement that does not
qualify as a master netting agreement or because the total
amount of collateral held or pledged exceeds the net derivative
fair value with the counterparty as of the balance sheet date
due to timing or other factors. To the extent not netted against
the derivative fair value under a master netting agreement, the
receivable for cash pledged is included in Other assets and the
obligation for cash held is included in Other borrowed funds
on our Consolidated Balance Sheet. Securities held from
counterparties are not recognized on our balance sheet.
Likewise securities we have pledged to counterparties remain
on our balance sheet.
Certain of the master netting agreements and certain other
derivative agreements also contain provisions that require
PNC’s debt to maintain an investment grade credit rating from
each of the major credit rating agencies. If PNC’s debt ratings
were to fall below investment grade, we would be in violation
of these provisions and the counterparties to the derivative
instruments could request immediate payment or demand
immediate and ongoing full overnight collateralization on
derivative instruments in net liability positions. The aggregate
fair value of all derivative instruments with credit-risk-related
contingent features that were in a net liability position on
December 31, 2014 was $681 million for which PNC had
posted collateral of $508 million in the normal course of
business. The maximum additional amount of collateral PNC
would have been required to post if the credit-risk-related
contingent features underlying these agreements had been
triggered on December 31, 2014 would be $173 million.
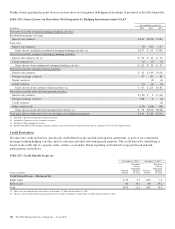
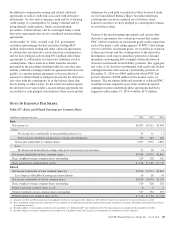
N
OTE
16 E
ARNINGS
P
ER
S
HARE
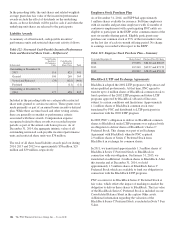
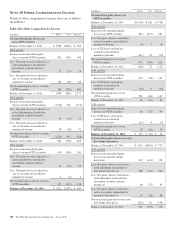
Table 137: Basic and Diluted Earnings per Common Share
In millions, except per share data 2014 2013 2012
Basic
Net income (a) $4,207 $4,212 $2,994
Less:
Net income (loss) attributable to noncontrolling interests (a) 23 11 (7)
Preferred stock dividends and discount accretion and redemptions 237 249 181
Net income attributable to common shares 3,947 3,952 2,820
Less:
Dividends and undistributed earnings allocated to nonvested restricted shares 11 18 14
Net income attributable to basic common shares $3,936 $3,934 $2,806
Basic weighted-average common shares outstanding 529 528 526
Basic earnings per common share (a) (b) $ 7.44 $ 7.45 $ 5.33
Diluted
Net income attributable to basic common shares (a) $3,936 $3,934 $2,806
Less: Impact of BlackRock earnings per share dilution 18 18 14
Net income attributable to diluted common shares $3,918 $3,916 $2,792
Basic weighted-average common shares outstanding 529 528 526
Dilutive potential common shares (c) (d) 843
Diluted weighted-average common shares outstanding 537 532 529
Diluted earnings per common share (a) (b) $ 7.30 $ 7.36 $ 5.28
(a) Amounts for 2013 and 2012 periods have been updated to reflect the first quarter 2014 adoption of ASU 2014-01 related to investments in low income housing tax credits.
(b) Basic and diluted earnings per share under the two-class method are determined on net income reported on the income statement less earnings allocated to nonvested restricted shares
(participating securities).
(c) Excludes number of stock options considered to be anti-dilutive of 1 million for 2013 and 4 million for 2012. No stock options were considered to be anti-dilutive for 2014.
(d) Excludes number of warrants considered to be anti-dilutive of 17 million for 2012. No warrants were considered to be anti-dilutive for 2013 and 2014.
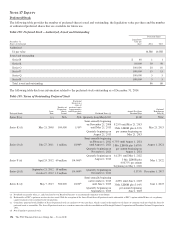
The PNC Financial Services Group, Inc. – Form 10-K 195