PNC Bank 2014 Annual Report Download - page 191
Download and view the complete annual report
Please find page 191 of the 2014 PNC Bank annual report below. You can navigate through the pages in the report by either clicking on the pages listed below, or by using the keyword search tool below to find specific information within the annual report.-
 1
1 -
2
-
3
-
4
-
5
-
6
-
7
-
8
-
9
-
10
-
11
-
12
-
13
-
14
-
15
-
16
-
17
-
18
-
19
-
20
-
21
-
22
-
23
-
24
-
25
-
26
-
27
-
28
-
29
-
30
-
31
-
32
-
33
-
34
-
35
-
36
-
37
-
38
-
39
-
40
-
41
-
42
-
43
-
44
-
45
-
46
-
47
-
48
-
49
-
50
-
51
-
52
-
53
-
54
-
55
-
56
-
57
-
58
-
59
-
60
-
61
-
62
-
63
-
64
-
65
-
66
-
67
-
68
-
69
-
70
-
71
-
72
-
73
-
74
-
75
-
76
-
77
-
78
-
79
-
80
-
81
-
82
-
83
-
84
-
85
-
86
-
87
-
88
-
89
-
90
-
91
-
92
-
93
-
94
-
95
-
96
-
97
-
98
-
99
-
100
-
101
-
102
-
103
-
104
-
105
-
106
-
107
-
108
-
109
-
110
-
111
-
112
-
113
-
114
-
115
-
116
-
117
-
118
-
119
-
120
-
121
-
122
-
123
-
124
-
125
-
126
-
127
-
128
-
129
-
130
-
131
-
132
-
133
-
134
-
135
-
136
-
137
-
138
-
139
-
140
-
141
-
142
-
143
-
144
-
145
-
146
-
147
-
148
-
149
-
150
-
151
-
152
-
153
-
154
-
155
-
156
-
157
-
158
-
159
-
160
-
161
-
162
-
163
-
164
-
165
-
166
-
167
-
168
-
169
-
170
-
171
-
172
-
173
-
174
-
175
-
176
-
177
-
178
-
179
-
180
-
 181
181 -
 182
182 -
 183
183 -
 184
184 -
 185
185 -
 186
186 -
 187
187 -
 188
188 -
 189
189 -
 190
190 -
 191
191 -
 192
192 -
 193
193 -
 194
194 -
 195
195 -
 196
196 -
 197
197 -
 198
198 -
 199
199 -
 200
200 -
 201
201 -
202
-
203
-
204
-
205
-
206
-
207
-
208
-
209
-
210
-
211
-
212
-
213
-
214
-
215
-
216
-
217
-
218
-
219
-
220
-
221
-
222
-
223
-
224
-
225
-
226
-
227
-
228
-
229
-
230
-
231
-
232
-
233
-
234
-
235
-
236
-
237
-
238
-
239
-
240
-
241
-
242
-
243
-
244
-
245
-
246
-
247
-
248
-
249
-
250
-
251
-
252
-
253
-
254
-
255
-
256
-
257
-
258
-
259
-
260
-
261
-
262
-
263
-
264
-
265
-
266
-
267
-
268
 |
 |

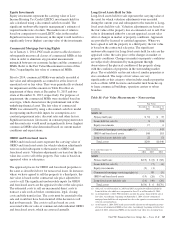
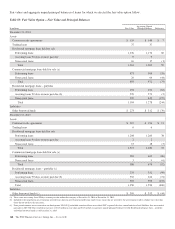
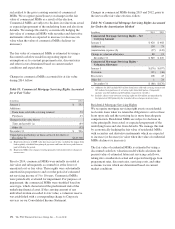
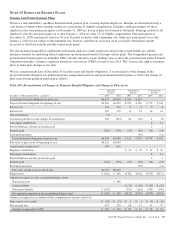
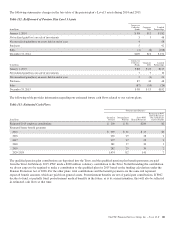
Changes in the residential MSRs follow:
Table 97: Residential Mortgage Servicing Rights
In millions 2014 2013 2012
January 1 $ 1,087 $ 650 $ 647
Additions:
From loans sold with
servicing retained 85 158 117
RBC Bank (USA)
acquisition (a) 16
Purchases 45 110 175
Sales (4)
Changes in fair value due to:
Time and payoffs (b) (134) (193) (167)
Other (c) (238) 366 (138)
December 31 $ 845 $ 1,087 $ 650
Unpaid principal balance of
loans serviced for others at
December 31 $108,010 $113,994 $119,262
(a) See Note 2 Acquisition and Divestiture Activity in our 2013 Form 10-K for
additional discussion of our 2012 acquisition of RBC Bank (USA).
(b) Represents decrease in MSR value due to passage of time, including the impact from
both regularly scheduled loan principal payments and loans that were paid down or
paid off during the period.
(c) Represents MSR value changes resulting primarily from market-driven changes in
interest rates.
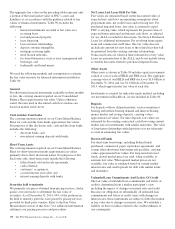
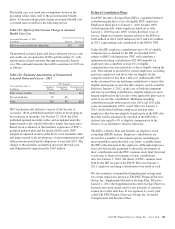
The fair value of commercial and residential MSRs and
significant inputs to the valuation models as of December 31,
2014 are shown in the tables below. The expected and actual
rates of mortgage loan prepayments are significant factors
driving the fair value. Management uses both internal
proprietary models and a third-party model to estimate future
commercial mortgage loan prepayments and a third-party
model to estimate future residential mortgage loan
prepayments. These models have been refined based on
current market conditions and management judgment. Future
interest rates are another important factor in the valuation of
MSRs. Management utilizes market implied forward interest
rates to estimate the future direction of mortgage and discount
rates. The forward rates utilized are derived from the current
yield curve for U.S. dollar interest rate swaps and are
consistent with pricing of capital markets instruments.
Changes in the shape and slope of the forward curve in future
periods may result in volatility in the fair value estimate.
A sensitivity analysis of the hypothetical effect on the fair
value of MSRs to adverse changes in key assumptions is
presented below. These sensitivities do not include the impact
of the related hedging activities. Changes in fair value
generally cannot be extrapolated because the relationship of
the change in the assumption to the change in fair value may
not be linear. Also, the effect of a variation in a particular
assumption on the fair value of the MSRs is calculated
independently without changing any other assumption. In
reality, changes in one factor may result in changes in another
(for example, changes in mortgage interest rates, which drive
changes in prepayment rate estimates, could result in changes
in the interest rate spread), which could either magnify or
counteract the sensitivities.
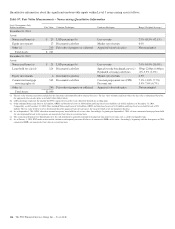
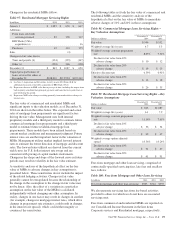
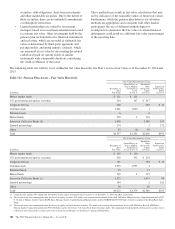
The following tables set forth the fair value of commercial and
residential MSRs and the sensitivity analysis of the
hypothetical effect on the fair value of MSRs to immediate
adverse changes of 10% and 20% in those assumptions:
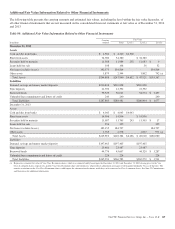
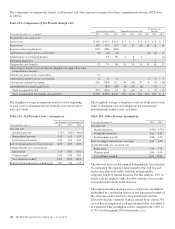
Table 98: Commercial Mortgage Loan Servicing Rights –
Key Valuation Assumptions
Dollars in millions
December 31
2014
December 31
2013
Fair value $ 506 $ 552
Weighted-average life (years) 4.7 5.3
Weighted-average constant prepayment
rate 8.03% 7.52%
Decline in fair value from 10%
adverse change $ 10 $ 12
Decline in fair value from 20%
adverse change $ 19 $ 23
Effective discount rate 6.59% 6.91%
Decline in fair value from 10%
adverse change $ 13 $ 18
Decline in fair value from 20%
adverse change $ 26 $ 35
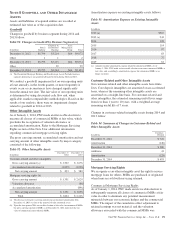
Table 99: Residential Mortgage Loan Servicing Rights – Key
Valuation Assumptions
Dollars in millions
December 31
2014
December 31
2013
Fair value $ 845 $1,087
Weighted-average life (years) 6.1 7.9
Weighted-average constant prepayment
rate 11.16% 7.61%
Decline in fair value from 10%
adverse change $ 36 $ 34
Decline in fair value from 20%
adverse change $ 69 $ 67
Weighted-average option adjusted
spread 10.36% 10.24%
Decline in fair value from 10%
adverse change $ 31 $ 47
Decline in fair value from 20%
adverse change $ 61 $ 91
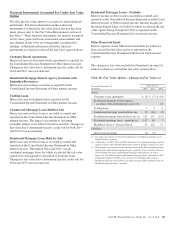
Fees from mortgage and other loan servicing, comprised of
contractually specified servicing fees, late fees and ancillary
fees, follows:
Table 100: Fees from Mortgage and Other Loan Servicing
In millions 2014 2013 2012
Fees from mortgage and other loan servicing $503 $544 $557
We also generate servicing fees from fee-based activities
provided to others for which we do not have an associated
servicing asset.
Fees from commercial and residential MSRs are reported on
our Consolidated Income Statement in the line items
Corporate services and Residential mortgage, respectively.
The PNC Financial Services Group, Inc. – Form 10-K 173