PNC Bank 2014 Annual Report Download - page 239
Download and view the complete annual report
Please find page 239 of the 2014 PNC Bank annual report below. You can navigate through the pages in the report by either clicking on the pages listed below, or by using the keyword search tool below to find specific information within the annual report.-
 1
1 -
2
-
3
-
4
-
5
-
6
-
7
-
8
-
9
-
10
-
11
-
12
-
13
-
14
-
15
-
16
-
17
-
18
-
19
-
20
-
21
-
22
-
23
-
24
-
25
-
26
-
27
-
28
-
29
-
30
-
31
-
32
-
33
-
34
-
35
-
36
-
37
-
38
-
39
-
40
-
41
-
42
-
43
-
44
-
45
-
46
-
47
-
48
-
49
-
50
-
51
-
52
-
53
-
54
-
55
-
56
-
57
-
58
-
59
-
60
-
61
-
62
-
63
-
64
-
65
-
66
-
67
-
68
-
69
-
70
-
71
-
72
-
73
-
74
-
75
-
76
-
77
-
78
-
79
-
80
-
81
-
82
-
83
-
84
-
85
-
86
-
87
-
88
-
89
-
90
-
91
-
92
-
93
-
94
-
95
-
96
-
97
-
98
-
99
-
100
-
101
-
102
-
103
-
104
-
105
-
106
-
107
-
108
-
109
-
110
-
111
-
112
-
113
-
114
-
115
-
116
-
117
-
118
-
119
-
120
-
121
-
122
-
123
-
124
-
125
-
126
-
127
-
128
-
129
-
130
-
131
-
132
-
133
-
134
-
135
-
136
-
137
-
138
-
139
-
140
-
141
-
142
-
143
-
144
-
145
-
146
-
147
-
148
-
149
-
150
-
151
-
152
-
153
-
154
-
155
-
156
-
157
-
158
-
159
-
160
-
161
-
162
-
163
-
164
-
165
-
166
-
167
-
168
-
169
-
170
-
171
-
172
-
173
-
174
-
175
-
176
-
177
-
178
-
179
-
180
-
181
-
182
-
183
-
184
-
185
-
186
-
187
-
188
-
189
-
190
-
191
-
192
-
193
-
194
-
195
-
196
-
197
-
198
-
199
-
200
-
201
-
202
-
203
-
204
-
205
-
206
-
207
-
208
-
209
-
210
-
211
-
212
-
213
-
214
-
215
-
216
-
217
-
218
-
219
-
220
-
221
-
222
-
223
-
224
-
225
-
226
-
227
-
228
-
 229
229 -
 230
230 -
 231
231 -
 232
232 -
 233
233 -
 234
234 -
 235
235 -
 236
236 -
 237
237 -
 238
238 -
 239
239 -
 240
240 -
 241
241 -
 242
242 -
 243
243 -
 244
244 -
 245
245 -
 246
246 -
 247
247 -
 248
248 -
 249
249 -
250
-
251
-
252
-
253
-
254
-
255
-
256
-
257
-
258
-
259
-
260
-
261
-
262
-
263
-
264
-
265
-
266
-
267
-
268
 |
 |

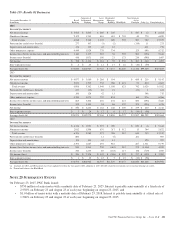
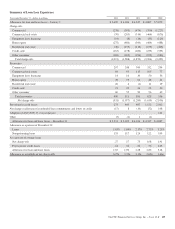
Table 159: Results Of Businesses
Year ended December 31
In millions
Retail
Banking
Corporate &
Institutional
Banking
Asset
Management
Group
Residential
Mortgage
Banking BlackRock
Non-Strategic
Assets
Portfolio Other (a) Consolidated (a)
2014
I
NCOME
S
TATEMENT
Net interest income $ 3,923 $ 3,605 $ 289 $ 149 $ 547 $ 12 $ 8,525
Noninterest income 2,125 1,743 818 651 $ 703 40 770 6,850
Total revenue 6,048 5,348 1,107 800 703 587 782 15,375
Provision for credit losses (benefit) 277 107 (1) (2) (119) 11 273
Depreciation and amortization 176 135 42 12 411 776
Other noninterest expense 4,449 1,929 779 734 125 696 8,712
Income (loss) before income taxes and noncontrolling interests 1,146 3,177 287 56 703 581 (336) 5,614
Income taxes (benefit) 418 1,071 106 21 173 214 (596) 1,407
Net income $ 728 $ 2,106 $ 181 $ 35 $ 530 $ 367 $ 260 $ 4,207
Inter-segment revenue $ 2 $ 23 $ 11 $ 17 $ 16 $ (10) $ (59)
Average Assets (b) $75,046 $122,927 $7,745 $ 7,857 $6,640 $ 8,338 $99,300 $327,853
2013
I
NCOME
S
TATEMENT
Net interest income $ 4,077 $ 3,680 $ 288 $ 194 $ 689 $ 219 $ 9,147
Noninterest income 2,021 1,702 752 906 $ 621 53 810 6,865
Total revenue 6,098 5,382 1,040 1,100 621 742 1,029 16,012
Provision for credit losses (benefit) 657 (25) 10 21 (21) 1 643
Depreciation and amortization 186 128 42 11 348 715
Other noninterest expense 4,390 1,871 732 834 163 976 8,966
Income (loss) before income taxes and noncontrolling interests 865 3,408 256 234 621 600 (296) 5,688
Income taxes (benefit) 315 1,144 94 86 152 221 (536) 1,476
Net income $ 550 $ 2,264 $ 162 $ 148 $ 469 $ 379 $ 240 $ 4,212
Inter-segment revenue $ 3 $ 28 $ 12 $ 8 $ 17 $ (10) $ (58)
Average Assets (b) $74,971 $112,970 $7,366 $ 9,896 $6,272 $ 9,987 $84,202 $305,664
2012
I
NCOME
S
TATEMENT
Net interest income $ 4,314 $ 3,991 $ 297 $ 209 $ 830 $ (1) $ 9,640
Noninterest income 2,012 1,598 676 317 $ 512 13 744 5,872
Total revenue 6,326 5,589 973 526 512 843 743 15,512
Provision for credit losses (benefit) 800 11 (5) 181 987
Depreciation and amortization 194 141 41 11 320 707
Other noninterest expense 4,392 1,887 691 981 287 1,541 9,779
Income (loss) before income taxes and noncontrolling interests 940 3,561 230 (461) 512 375 (1,118) 4,039
Income taxes (benefit) 344 1,233 85 (153) 117 138 (719) 1,045
Net income (loss) $ 596 $ 2,328 $ 145 $ (308) $ 395 $ 237 $ (399) $ 2,994
Inter-segment revenue $ 1 $ 33 $ 12 $ 7 $ 15 $ (10) $ (58)
Average Assets (b) $72,573 $102,962 $6,735 $11,529 $5,857 $12,050 $83,248 $294,954
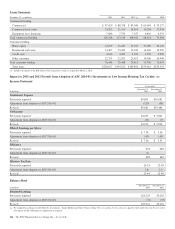
(a) Amounts for 2013 and 2012 periods have been updated to reflect the first quarter 2014 adoption of ASU 2014-01 related to investments in low income housing tax credits.
(b) Period-end balances for BlackRock.
N
OTE
25 S
UBSEQUENT
E
VENTS
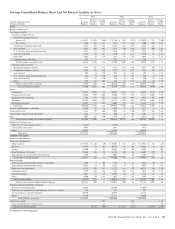
On February 23, 2015, PNC Bank issued:
• $750 million of senior notes with a maturity date of February 23, 2025. Interest is payable semi-annually at a fixed rate of
2.950% on February 23 and August 23 of each year, beginning on August 23, 2015, and
• $1.0 billion of senior notes with a maturity date of February 23, 2018. Interest is payable semi-annually at a fixed rate of
1.500% on February 23 and August 23 of each year, beginning on August 23, 2015.
The PNC Financial Services Group, Inc. – Form 10-K 221