PNC Bank 2014 Annual Report Download - page 244
Download and view the complete annual report
Please find page 244 of the 2014 PNC Bank annual report below. You can navigate through the pages in the report by either clicking on the pages listed below, or by using the keyword search tool below to find specific information within the annual report.-
 1
1 -
2
-
3
-
4
-
5
-
6
-
7
-
8
-
9
-
10
-
11
-
12
-
13
-
14
-
15
-
16
-
17
-
18
-
19
-
20
-
21
-
22
-
23
-
24
-
25
-
26
-
27
-
28
-
29
-
30
-
31
-
32
-
33
-
34
-
35
-
36
-
37
-
38
-
39
-
40
-
41
-
42
-
43
-
44
-
45
-
46
-
47
-
48
-
49
-
50
-
51
-
52
-
53
-
54
-
55
-
56
-
57
-
58
-
59
-
60
-
61
-
62
-
63
-
64
-
65
-
66
-
67
-
68
-
69
-
70
-
71
-
72
-
73
-
74
-
75
-
76
-
77
-
78
-
79
-
80
-
81
-
82
-
83
-
84
-
85
-
86
-
87
-
88
-
89
-
90
-
91
-
92
-
93
-
94
-
95
-
96
-
97
-
98
-
99
-
100
-
101
-
102
-
103
-
104
-
105
-
106
-
107
-
108
-
109
-
110
-
111
-
112
-
113
-
114
-
115
-
116
-
117
-
118
-
119
-
120
-
121
-
122
-
123
-
124
-
125
-
126
-
127
-
128
-
129
-
130
-
131
-
132
-
133
-
134
-
135
-
136
-
137
-
138
-
139
-
140
-
141
-
142
-
143
-
144
-
145
-
146
-
147
-
148
-
149
-
150
-
151
-
152
-
153
-
154
-
155
-
156
-
157
-
158
-
159
-
160
-
161
-
162
-
163
-
164
-
165
-
166
-
167
-
168
-
169
-
170
-
171
-
172
-
173
-
174
-
175
-
176
-
177
-
178
-
179
-
180
-
181
-
182
-
183
-
184
-
185
-
186
-
187
-
188
-
189
-
190
-
191
-
192
-
193
-
194
-
195
-
196
-
197
-
198
-
199
-
200
-
201
-
202
-
203
-
204
-
205
-
206
-
207
-
208
-
209
-
210
-
211
-
212
-
213
-
214
-
215
-
216
-
217
-
218
-
219
-
220
-
221
-
222
-
223
-
224
-
225
-
226
-
227
-
228
-
229
-
230
-
231
-
232
-
233
-
 234
234 -
 235
235 -
 236
236 -
 237
237 -
 238
238 -
 239
239 -
 240
240 -
 241
241 -
 242
242 -
 243
243 -
 244
244 -
 245
245 -
 246
246 -
 247
247 -
 248
248 -
 249
249 -
 250
250 -
 251
251 -
 252
252 -
 253
253 -
 254
254 -
255
-
256
-
257
-
258
-
259
-
260
-
261
-
262
-
263
-
264
-
265
-
266
-
267
-
268
 |
 |

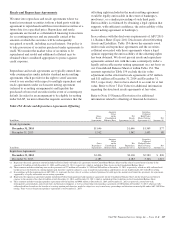
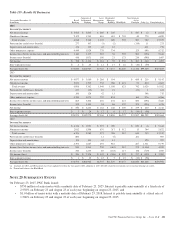
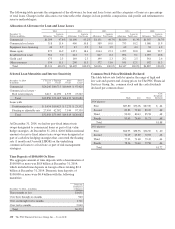
Loans Summary
December 31 – in millions 2014 2013 2012 (a) 2011 2010
Commercial lending
Commercial $ 97,420 $ 88,378 $ 83,040 $ 65,694 $ 55,177
Commercial real estate 23,262 21,191 18,655 16,204 17,934
Equipment lease financing 7,686 7,576 7,247 6,416 6,393
Total commercial lending 128,368 117,145 108,942 88,314 79,504
Consumer lending
Home equity 34,677 36,447 35,920 33,089 34,226
Residential real estate 14,407 15,065 15,240 14,469 15,999
Credit card 4,612 4,425 4,303 3,976 3,920
Other consumer 22,753 22,531 21,451 19,166 16,946
Total consumer lending 76,449 78,468 76,914 70,700 71,091
Total loans $204,817 $195,613 $185,856 $159,014 $150,595
(a) Includes the impact of the RBC Bank (USA) acquisition, which we acquired on March 2, 2012.
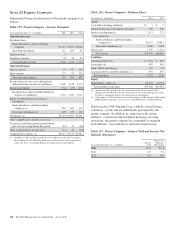
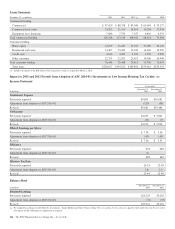
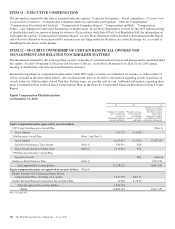
Impact to 2013 and 2012 Periods from Adoption of ASU 2014-01 (Investments in Low Income Housing Tax Credits) (a)
Income Statement
Year ended
In millions
December 31
2013
December 31
2012
Noninterest Expense
Previously reported $9,801 $10,582
Adjustment from adoption of ASU 2014-01 (120) (96)
Revised $9,681 $10,486
Net Income
Previously reported $4,227 $ 3,001
Adjustment from adoption of ASU 2014-01 (15) (7)
Revised $4,212 $ 2,994
Diluted Earnings per Share
Previously reported $ 7.39 $ 5.36
Adjustment from adoption of ASU 2014-01 (.03) (.03)
Revised $ 7.36 $ 5.33
Efficiency
Previously reported 61% 68%
Adjustment from adoption of ASU 2014-01 (1)
Revised 60% 68%
Effective Tax Rate
Previously reported 24.1% 23.9%
Adjustment from adoption of ASU 2014-01 1.8 2.0
Revised 25.9% 25.9%
Balance Sheet
In millions
December 31
2013
December 31
2012
Retained Earnings
Previously reported $23,325 20,265
Adjustment from adoption of ASU 2014-01 (74) (55)
Revised $23,251 20,210
(a) We adopted the guidance in ASU 2014-01, Investments – Equity Method and Joint Ventures (Topic 323): Accounting For Investments in Qualified Affordable Housing Projects in the
first quarter of 2014. Retrospective application is required.
226 The PNC Financial Services Group, Inc. – Form 10-K