OG&E 2015 Annual Report Download - page 9
Download and view the complete annual report
Please find page 9 of the 2015 OG&E annual report below. You can navigate through the pages in the report by either clicking on the pages listed below, or by using the keyword search tool below to find specific information within the annual report.-
 1
1 -
 2
2 -
 3
3 -
 4
4 -
 5
5 -
 6
6 -
 7
7 -
 8
8 -
 9
9 -
 10
10 -
 11
11 -
 12
12 -
 13
13 -
 14
14 -
 15
15 -
 16
16 -
 17
17 -
 18
18 -
 19
19 -
 20
20 -
21
-
22
-
23
-
24
-
25
-
26
-
27
-
28
-
29
-
30
-
31
-
32
-
33
-
34
-
35
-
36
-
37
-
38
-
39
 |
 |

OGE Energy Corp. 15
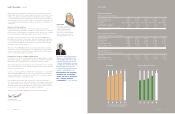
2015 compared to 2014. OG&E’snetincomedecreased$23.1million,
or7.9percent,in2015ascomparedto2014primarilyduetohigher
depreciationexpenseandlowergrossmarginpartiallyoffsetbyhigher
otherincomeandanincreaseinallowanceforequityfundsusedin
construction.
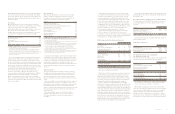
GrossMargin
Operatingrevenueswere$2,196.9millionin2015ascomparedto
$2,453.1millionin2014,adecreaseof$256.2million,or10.4percent.
Costofsaleswere$865.0millionin2015ascomparedto
$1,106.6millionin2014,adecreaseof$241.6million,or21.8percent.
Grossmarginwas$1,331.9millionin2015ascomparedto
$1,346.5millionin2014,adecreaseof$14.6million,or1.1percent.
Thebelowfactorscontributedtothechangeingrossmargin:
(Inmillions) $Change
Quantityvariance(primarilyweather)(A) $(25.8)
Wholesaletransmissionrevenue(B) (19.8)
ExpirationofAVECcontract(C) (11.5)
Industrialandoilfieldsale (4.5)
Other 2.1
Non-residentialdemandandrelatedrevenues 3.7
Pricevariance(D) 19.8
Newcustomergrowth 21.4
Changeingrossmargin $(14.6)
(A)Theoverallcoolingdegreedaysdecreasedtwopercentin2015comparedto2014
withAugustdecreasingby14percent.
(B)DecreasedprimarilyduetoatrueupforthebaseplanprojectsintheSPPformula
ratefor2014and2015aswellasareductioninthepoint-to-pointcreditssharedwith
retailcustomers.
(C)OnJune30,2015,thewholesalepowercontractwithAVECexpired.
(D)Increasedprimarilyduetosalesandcustomermix.
CostofsalesforOG&Econsistsoffuelusedinelectricgeneration,
purchasedpowerandtransmissionrelatedcharges.Fuelexpense
was$458.5millionin2015ascomparedto$627.5millionin2014,
adecreaseof$169.0million,or26.9percent,primarilyduetolower
naturalgaspricesoffsetbyhighernaturalgasusedaswellasless
coalburnedoffsetbyhighercoalprices.In2015,OG&E’sfuelmixwas
49.0percentcoal,44.0percentnaturalgasandsevenpercentwind.
In2014,OG&E’sfuelmixwas61.0percentcoal,32.0percentnatural
gasandsevenpercentwind.Purchasedpowercostswere$362.6million
in2015ascomparedto$444.1millionin2014,adecreaseof
$81.5million,or18.4percent,primarilyduetoadecreaseinpurchases
fromtheSPP,reflectingtheimpactofOG&E sparticipationintheSPP
IntegratedMarketplace,whichbeganonMarch1,2014.Transmission
relatedchargeswere$43.9millionin2015ascomparedto
$35.0millionin2014,anincreaseof$8.9million,or25.4percent,
primarilyduetohigherSPPchargesforthebaseplanprojectsof
otherutilities.
Theactualcostoffuelusedinelectricgenerationandcertain
purchasedpowercostsarepassedthroughtoOG&E’scustomers
throughfueladjustmentclauses.Thefueladjustmentclausesare
subjecttoperiodicreviewbytheOCC,theAPSCandtheFERC.
TheOCC,theAPSCandtheFERChaveauthoritytoreviewthe
appropriatenessofgastransportationchargesorotherfeesOG&E
paystoitsaffiliat ,Enable.
OperatingExpenses
Otheroperationandmaintenanceexpenseswere$444.5million
in2015ascomparedto$453.2millionin2014,adecreaseof
$8.7million,or1.9percent.Thebelowfactorscontributedtothe
changeinotheroperationsandmaintenanceexpense:
(Inmillions) $Change
Additionalcapitalizedlabor(A) $(9.2)
Maintenanceatpowerplants(B) (7.0)
Professionalservicecontracts(C) (2.1)
Other (1.0)
Employeebenefit (D) 1.0
Othermarketing,salesandcommercial(E) 2.8
Salariesandwages(F) 6.8
Changeinotheroperationandmaintenanceexpense $(8.7)
(A)Decreasedprimarilyduetomorecapitalprojectsandstormcostsexceedingthe
$2.7millionthreshold,whichweremovedtoaregulatoryasset.
(B)Decreasedprimarilyduetolessworkatthepowerplants.
(C)Decreasedprimarilyduetodecreasedengineeringservices.
(D)Increasedprimarilyduetohighermedicalcostsincurredpartiallyoffsetbylower
pensioncosts.
(E)Increasedprimarilyduetohigherdemandsidemanagementcustomerpayments.
(F)Increasedprimarilyduetoannualsalaryincreasesandincreasedovertimerelated
tostorms.
Depreciationandamortizationexpensewas$299.9millionin2015
ascomparedto$270.8millionin2014,anincreaseof$29.1million,or
10.7percent,primarilyduetoadditionalassetsbeingplacedinservice,
alongwithanincreaseresultingfromtheamortizationofdeferred
pensioncreditsandpost-retirementmedicalregulatoryliabilities
whichwerefullyamortizedinJuly2014andamortizationofdeferred
stormcosts.
AdditionalInformation
AllowanceforEquityFundsUsedDuringConstruction.Allowancefor
equityfundsusedduringconstructionwas$8.3millionin2015as
comparedto$4.2millionin2014,anincreaseof$4.1millionor
97.6percent,primarilyduetohigherconstructionworkinprogress
balancesresultingfromincreasedspendingforenvironmentalprojects.
OtherIncome.Otherincomewas$13.3millionin2015ascompared
to$4.8millionin2014,anincreaseof$8.5million,primarilydueto
increasedguaranteedflatbillmarginsandanincreaseinthetax ross
uprelatedtohigherallowanceforfundsusedduringconstruction.
IncomeTaxExpense.Incometaxexpensewas$104.8millionin
2015ascomparedto$111.6millionin2014,adecreaseof
$6.8million,or6.1percent,primarilyduetolowerpretaxincome
partiallyoffsetbyareductioninFederaltaxcredits.
14 OGE Energy Corp.
Reconciliation of Gross Margin to Revenue
YearEndedDecember31,(Dollarsinmillions) 2016(A)
Operatingrevenues $2,162
Costofsales 752
GrossMargin $1,410
(A) BasedonthemidpointofOG&Eearningsguidancefor2016.
Results of Operations
Thefollowingdiscussionandanalysispresentsfactorsthataffected
theCompany’sconsolidatedresultsofoperationsfortheyearsended
December31,2015,2014and2013andtheCompany’sconsolidated
financialpositionatDecember31,2015and2014 Thefollowing
informationshouldbereadinconjunctionwiththeConsolidated
FinancialStatementsandNotesthereto.Knowntrendsand
contingenciesofamaterialnaturearediscussedtotheextent
consideredrelevant.
YearendedDecember31
(Inmillionsexceptpersharedata)2015 2014 2013
Netincomeattributable
toOGEEnergy $ 271.3 $ 395.8 $ 387.6
Basicaveragecommon
sharesoutstanding 199.6 199.2 198.2
Dilutedaveragecommon
sharesoutstanding 199.6 199.9 199.4
Basicearningsperaverage
commonshareattributable
toOGEEnergycommon
shareholders $ 1.36 $ 1.99 $ 1.96
Dilutedearningsperaverage
commonshareattributable
toOGEEnergycommon
shareholders $ 1.36 $ 1.98 $ 1.94
Dividendsdeclared
percommonshare $1.05000 $0.95000 $0.85125
Results by Business Segment
YearendedDecember31
(Inmillions)2015 2014 2013
NetIncomeattributabletoOGEEnergy
OG&E(ElectricUtility) $268.9 $292.0 $292.6
OGEHoldings(Natural
GasMidstreamOperations)(A)9.4 102.3 99.9
OtherOperations(B)(7.0) 1.5 (4.9)
Consolidatednetincome
attributabletoOGEEnergy $271.3 $395.8 $387.6
(A)SubsequenttothecompletionoftheOctober1,2014annualgoodwillimpairmenttest
andpreviousinterimassessmentasofDecember31,2014,thecrudeoilandnatural
gasindustrywasimpactedbyfurthercommoditypricedeclines,whichconsequently
resultedindecreasedproduceractivityincertainregionsinwhichEnableoperates.
Asaresult,whenEnableperformedthefirststepofitsan ualgoodwillimpairment
analysisasofOctober1,2015,itdeterminedthatthecarryingvalueofthegathering
andprocessingandtransportationandstoragesegmentsexceededfairvalue.Enable
completedthesecondstepofthegoodwillimpairmentanalysiscomparingtheimplied
fairvalueforthosereportingunitstothecarryingamountofthatgoodwilland
determinedthatgoodwillforthoseunitswascompletelyimpairedintheamountof
$1,086.4millionasofSeptember30,2015.Accordingly,theCompanyrecordeda
$108.4millionpre-taxchargeduringthethirdquarterof2015foritsshareofthe
goodwillimpairment,asadjustedforthebasisdifferences.SeeNote3forfurther
discussionofEnable’sgoodwillimpairment.
(B)OtherOperationsprimarilyincludestheoperationsoftheholdingcompanyand
consolidatingeliminations.
Thefollowingoperatingresultsanalysisbybusinesssegmentincludes
intercompanytransactionsthatareeliminatedintheConsolidated
FinancialStatements.
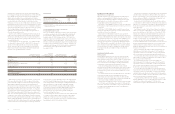
OG&E (Electric Utility)
YearendedDecember31(Dollarsinmillions)2015 2014 2013
Operatingrevenues $2,196.9 $2,453.1 $2,262.2
Costofsales 865.0 1,106.6 965.9
Otheroperationandmaintenance 444.5 453.2 438.8
Depreciationandamortization 299.9 270.8 248.4
Taxesotherthanincome 87.1 84.5 83.8
Operatingincome 500.4 538.0 525.3
Allowanceforequityfundsused
duringconstruction 8.3 4.2 6.6
Otherincome 13.3 4.8 8.1
Otherexpense 1.6 1.9 4.6
Interestexpense 146.7 141.5 129.3
Incometaxexpense 104.8 111.6 113.5
Netincome $ 268.9 $ 292.0 $ 292.6
Operatingrevenuesbyclassificatio
Residential $ 896.5 $ 925.5 $ 901.4
Commercial 535.0 583.3 554.2
Industrial 190.6 224.5 220.6
Oilfield 162.8 188.3 176.4
Publicauthoritiesandstreetlight 194.2 220.3 214.3
Salesforresale 21.7 52.9 59.4
Systemsalesrevenues 2,000.8 2,194.8 2,126.3
Off-systemsalesrevenues 48.6 94.1 14.7
Other 147.5 164.2 121.2
Totaloperatingrevenues $2,196.9 $2,453.1 $2,262.2
Reconciliationofgrossmargintorevenue:
Operatingrevenues $2,196.9 $2,453.1 $2,262.2
Costofsales 865.0 1,106.6 965.9
Grossmargin $1,331.9 $1,346.5 $1,296.3
MWHsalesbyclassificatio (inmillions)
Residential 9.2 9.4 9.4
Commercial 7.4 7.2 7.1
Industrial 3.6 3.8 3.9
Oilfield 3.4 3.4 3.4
Publicauthoritiesandstreetlight 3.1 3.2 3.2
Salesforresale 0.5 1.0 1.2
Systemsales 27.2 28.0 28.2
Off-systemsales 1.7 2.2 0.4
Totalsales 28.9 30.2 28.6
Numberofcustomers 824,776 814,982 806,940
Weighted-averagecostofenergy
perkilowatt-hour–cents
Naturalgas 2.529 4.506 3.905
Coal 2.187 2.152 2.273
Totalfuel 2.196 2.752 2.784
Totalfuelandpurchasedpower 2.874 3.493 3.178
Degreedays(A)
Heating–Actual 3,038 3,569 3,673
Heating–Normal 3,349 3,349 3,349
Cooling–Actual 2,071 2,114 2,106
Cooling–Normal 2,092 2,092 2,092
(A)
Degreedaysarecalculatedasfollows:Thehighandlowdegreesofaparticularday
areaddedtogetherandthenaveraged.Ifthecalculatedaverageisabove65degrees,
thenthedifferencebetweenthecalculatedaverageand65isexpressedascooling
degreedays,witheachdegreeofdifferenceequalingonecoolingdegreeday.Ifthe
calculatedaverageisbelow65degrees,thenthedifferencebetweenthecalculated
averageand65isexpressedasheatingdegreedays,witheachdegreeofdifference
equalingoneheatingdegreeday.Thedailycalculationsarethentotaledforthe
particularreportingperiod.