OG&E 2015 Annual Report Download - page 21
Download and view the complete annual report
Please find page 21 of the 2015 OG&E annual report below. You can navigate through the pages in the report by either clicking on the pages listed below, or by using the keyword search tool below to find specific information within the annual report.-
 1
1 -
2
-
3
-
4
-
5
-
6
-
7
-
8
-
9
-
10
-
 11
11 -
 12
12 -
 13
13 -
 14
14 -
 15
15 -
 16
16 -
 17
17 -
 18
18 -
 19
19 -
 20
20 -
 21
21 -
 22
22 -
 23
23 -
 24
24 -
 25
25 -
 26
26 -
 27
27 -
 28
28 -
 29
29 -
 30
30 -
 31
31 -
32
-
33
-
34
-
35
-
36
-
37
-
38
-
39
 |
 |

OGE Energy Corp. 39
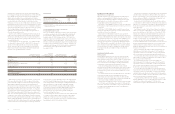
Consolidated Statements of Changes in Stockholders’ Equity
Accumulated
Other
Premiumon Retained Comprehensive Noncontrolling Treasury
(Inmillions) CommonStock CommonStock Earnings Income(Loss) Interest Stock Total
Balance at December 31, 2012 $1.0 $1,046.4 $1,772.4 $(49.1) $305.2 $(3.5) $3,072.4
Netincome — — 387.6 — 6.2 — 393.8
Othercomprehensiveincome,netoftax — — — 27.0 0.1 — 27.1
Dividendsdeclaredoncommonstock — — (168.8) — — — (168.8)
Issuanceofcommonstock — 14.2 — — — — 14.2
Stock-basedcompensation — (1.8) — — (0.8) 3.5 0.9
Contributionsfromnoncontrollinginterestpartners — 22.5 — — 84.5 — 107.0
Distributionstononcontrollinginterestpartners — — — — (2.5) — (2.5)
DeconsolidationofEnogexHoldings — — 0.5 (6.1) (392.7) — (398.3)
Deferredincometaxesattributabletocontributions
fromnoncontrollinginterestpartners — (8.7) — — — — (8.7)
2-for-1forwardstocksplit 1.0 (1.0) — — — — —
Balance at December 31, 2013 $2.0 $1,071.6 $1,991.7 $(28.2) $ — $ — $3,037.1
Netincome — — 395.8 — — — 395.8
Othercomprehensiveincome,netoftax — — — (13.2) — — (13.2)
Dividendsdeclaredoncommonstock — — (189.3) — — — (189.3)
Issuanceofcommonstock — 13.2 — — — — 13.2
Stock-basedcompensation — 0.8 — — — — 0.8
Balance at December 31, 2014 $2.0 $1,085.6 $2,198.2 $(41.4) $ — $ — $3,244.4
Netincome — — 271.3 — — — 271.3
Othercomprehensiveincome,netoftax — — — 6.3 — — 6.3
Dividendsdeclaredoncommonstock — — (209.7) — — — (209.7)
Issuanceofcommonstock — 7.2 — — — — 7.2
Stock-basedcompensation — 6.5 — — — — 6.5
Balance at December 31, 2015 $2.0 $1,099.3 $2,259.8 $(35.1) $ — $ — $3,326.0
TheaccompanyingNotestoConsolidatedFinancialStatementsareanintegralparthereof.
38 OGE Energy Corp.
Consolidated Statements of Capitalization
December31(Inmillions)2015 2014
Stockholders’ Equity
Commonstock,parvalue$0.01pershare;authorized450.0shares;
andoutstanding199.7and199.4shares,respectively $ 2.0 $ 2.0
Premiumoncommonstock 1,099.3 1,085.6
Retainedearnings 2,259.8 2,198.2
Accumulatedothercomprehensiveloss,netoftax (35.1) (41.4)
Totalstockholders’equity 3,326.0 3,244.4
Long-Term Debt
SeniorNotes–OGEEnergy
0.93%VariableSeniorNotes,SeriesDueNovember24,2017 100.0 100.0
SeniorNotes–OG&E
5.15%SeniorNotes,SeriesDueJanuary15,2016 110.0 110.0
6.50%SeniorNotes,SeriesDueJuly15,2017 125.0 125.0
6.35%SeniorNotes,SeriesDueSeptember1,2018 250.0 250.0
8.25%SeniorNotes,SeriesDueJanuary15,2019 250.0 250.0
6.65%SeniorNotes,SeriesDueJuly15,2027 125.0 125.0
6.50%SeniorNotes,SeriesDueApril15,2028 100.0 100.0
5.75%SeniorNotes,SeriesDueJanuary15,2036 110.0 110.0
6.45%SeniorNotes,SeriesDueFebruary1,2038 200.0 200.0
5.85%SeniorNotes,SeriesDueJune1,2040 250.0 250.0
5.25%SeniorNotes,SeriesDueMay15,2041 250.0 250.0
3.90%SeniorNotes,SeriesDueMay1,2043 250.0 250.0
4.55%SeniorNotes,SeriesDueMarch15,2044 250.0 250.0
4.00%SeniorNotes,SeriesDueDecember15,2044 250.0 250.0
3.70%TinkerDebt,DueAugust31,2062 10.0 10.2
OtherBonds–OG&E
0.05%–0.13%GarfieldIndust ialAuthority,January1,2025 47.0 47.0
0.06%–0.19%MuskogeeIndustrialAuthority,January1,2025 32.4 32.4
0.05%–0.14%MuskogeeIndustrialAuthority,June1,2027 56.0 56.0
Unamortizeddiscount (9.8) (10.3)
Totallong-termdebt 2,755.6 2,755.3
Lesslong-termdebtduewithinoneyear (110.0) —
Totallong-termdebt(excludingdebtduewithinoneyear) 2,645.6 2,755.3
TotalCapitalization(includinglong-termdebtduewithinoneyear) $6,081.6 $5,999.7
TheaccompanyingNotestoConsolidatedFinancialStatementsareanintegralparthereof.