Nokia 2007 Annual Report Download - page 77
Download and view the complete annual report
Please find page 77 of the 2007 Nokia annual report below. You can navigate through the pages in the report by either clicking on the pages listed below, or by using the keyword search tool below to find specific information within the annual report.-
 1
1 -
2
-
3
-
4
-
5
-
6
-
7
-
8
-
9
-
10
-
11
-
12
-
13
-
14
-
15
-
16
-
17
-
18
-
19
-
20
-
21
-
22
-
23
-
24
-
25
-
26
-
27
-
28
-
29
-
30
-
31
-
32
-
33
-
34
-
35
-
36
-
37
-
38
-
39
-
40
-
41
-
42
-
43
-
44
-
45
-
46
-
47
-
48
-
49
-
50
-
51
-
52
-
53
-
54
-
55
-
56
-
57
-
58
-
59
-
60
-
61
-
62
-
63
-
64
-
65
-
66
-
 67
67 -
 68
68 -
 69
69 -
 70
70 -
 71
71 -
 72
72 -
 73
73 -
 74
74 -
 75
75 -
 76
76 -
 77
77 -
 78
78 -
 79
79 -
 80
80 -
 81
81 -
 82
82 -
 83
83 -
 84
84 -
 85
85 -
 86
86 -
 87
87 -
88
-
89
-
90
-
91
-
92
-
93
-
94
-
95
-
96
-
97
-
98
-
99
-
100
-
101
-
102
-
103
-
104
-
105
-
106
-
107
-
108
-
109
-
110
-
111
-
112
-
113
-
114
-
115
-
116
-
117
-
118
-
119
-
120
-
121
-
122
-
123
-
124
-
125
-
126
-
127
-
128
-
129
-
130
-
131
-
132
-
133
-
134
-
135
-
136
-
137
-
138
-
139
-
140
-
141
-
142
-
143
-
144
-
145
-
146
-
147
-
148
-
149
-
150
-
151
-
152
-
153
-
154
-
155
-
156
-
157
-
158
-
159
-
160
-
161
-
162
-
163
-
164
-
165
-
166
-
167
-
168
-
169
-
170
-
171
-
172
-
173
-
174
-
175
-
176
-
177
-
178
-
179
-
180
-
181
-
182
-
183
-
184
-
185
-
186
-
187
-
188
-
189
-
190
-
191
-
192
-
193
-
194
-
195
-
196
-
197
-
198
-
199
-
200
-
201
-
202
-
203
-
204
-
205
-
206
-
207
-
208
-
209
-
210
-
211
-
212
-
213
-
214
-
215
-
216
-
217
-
218
-
219
-
220
 |
 |
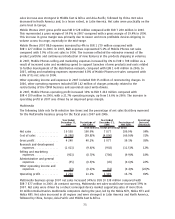
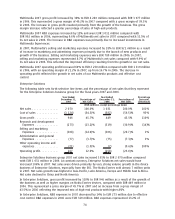
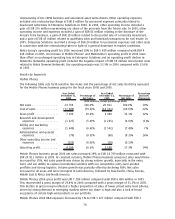
compared with EUR 544 million in 2006. Nokia Siemens Networks’ selling and marketing expenses
represented 10.4% of its net sales in 2007 reflecting the impact of restructuring charges and other
one time items of EUR 149 million and purchase price accounting related items of EUR 214 million
compared with 7.3% in 2006.
In 2007, other operating income and expenses included a restructuring charge and other items of
EUR 58 million and a gain on sale of real estate of EUR 53 million. In 2006, other operating income
and expenses included a gain of EUR 276 million representing our share of the proceeds from the
Telsim sale.
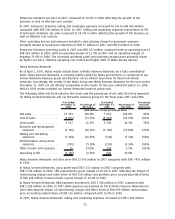
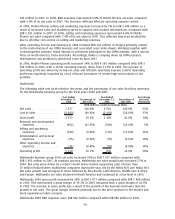
Nokia Siemens Networks 2007 operating loss was EUR 1 308 million compared to an operating profit
of EUR 808 million in 2006. In 2007, the operating loss included a charge of EUR 1 110 million related
to Nokia Siemens Networks’ restructuring costs and other items and a gain on sale of real estate of
EUR 53 million. The operating loss in 2007 also included EUR 570 million of intangible asset
amortization and other purchase price accounting related items. In 2006, Nokia Siemens Network’s
operating profit included the negative impact of EUR 39 million incremental costs related to Nokia
Siemens Networks. Nokia Siemens Networks’ operating margin for 2007 was negative 9.8% compared
with positive 10.8% in 2006. The lower operating profit primarily reflected the impact of
restructuring charges, intangible asset amortization and other purchase price accounting related
items as well as pricing pressures, a greater proportion of sales from the emerging markets and a
higher share of service sales.
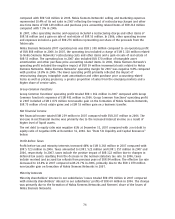
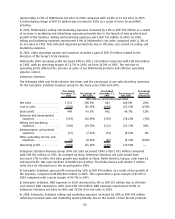
Group Common Functions
Group Common Functions’ operating profit totaled EUR 1 362 million in 2007 compared with Group
Common Function’s expenses of EUR 481 million in 2006. Group Common Functions’ operating profit
in 2007 included a EUR 1 879 million nontaxable gain on the formation of Nokia Siemens Networks,
EUR 75 million of real estate gains and a EUR 53 million gain on a business transfer.
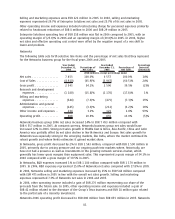
Net Financial Income
Net financial income totaled EUR 239 million in 2007 compared with EUR 207 million in 2006. The
increase in net financial income was primarily due to the increased interest income as a result of
higher level of liquid assets.
The net debt to equity ratio was negative 61% at December 31, 2007 compared with a net debt to
equity ratio of negative 68% at December 31, 2006. See “Item 5.B Liquidity and Capital Resources”
below.
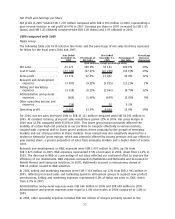
Profit Before Taxes
Profit before tax and minority interests increased 44% to EUR 8 268 million in 2007 compared with
EUR 5 723 million in 2006. Taxes amounted to EUR 1 522 million and EUR 1 357 million in 2007 and
2006, respectively. In 2007, taxes include the positive impact of EUR 122 million due to changes in
deferred tax assets resulting from the decrease in the German statutory tax rate. In 2006, taxes
include received and accrued tax refunds from previous years of EUR 84 million. The effective tax rate
decreased to 18.4% in 2007 compared with 23.7% in 2006, primarily due to the EUR 1 879 million
nontaxable gain on formation of Nokia Siemens Networks in 2007.
Minority Interests
Minority shareholders’ interest in our subsidiaries’ losses totaled EUR 459 million in 2007 compared
with minority shareholders’ interest in our subsidiaries’ profits of EUR 60 million in 2006. The change
was primarily due to the formation of Nokia Siemens Networks and Siemens’ share of the losses of
Nokia Siemens Networks.
76