Nokia 2007 Annual Report Download - page 62
Download and view the complete annual report
Please find page 62 of the 2007 Nokia annual report below. You can navigate through the pages in the report by either clicking on the pages listed below, or by using the keyword search tool below to find specific information within the annual report.-
 1
1 -
2
-
3
-
4
-
5
-
6
-
7
-
8
-
9
-
10
-
11
-
12
-
13
-
14
-
15
-
16
-
17
-
18
-
19
-
20
-
21
-
22
-
23
-
24
-
25
-
26
-
27
-
28
-
29
-
30
-
31
-
32
-
33
-
34
-
35
-
36
-
37
-
38
-
39
-
40
-
41
-
42
-
43
-
44
-
45
-
46
-
47
-
48
-
49
-
50
-
51
-
 52
52 -
 53
53 -
 54
54 -
 55
55 -
 56
56 -
 57
57 -
 58
58 -
 59
59 -
 60
60 -
 61
61 -
 62
62 -
 63
63 -
 64
64 -
 65
65 -
 66
66 -
 67
67 -
 68
68 -
 69
69 -
 70
70 -
 71
71 -
 72
72 -
73
-
74
-
75
-
76
-
77
-
78
-
79
-
80
-
81
-
82
-
83
-
84
-
85
-
86
-
87
-
88
-
89
-
90
-
91
-
92
-
93
-
94
-
95
-
96
-
97
-
98
-
99
-
100
-
101
-
102
-
103
-
104
-
105
-
106
-
107
-
108
-
109
-
110
-
111
-
112
-
113
-
114
-
115
-
116
-
117
-
118
-
119
-
120
-
121
-
122
-
123
-
124
-
125
-
126
-
127
-
128
-
129
-
130
-
131
-
132
-
133
-
134
-
135
-
136
-
137
-
138
-
139
-
140
-
141
-
142
-
143
-
144
-
145
-
146
-
147
-
148
-
149
-
150
-
151
-
152
-
153
-
154
-
155
-
156
-
157
-
158
-
159
-
160
-
161
-
162
-
163
-
164
-
165
-
166
-
167
-
168
-
169
-
170
-
171
-
172
-
173
-
174
-
175
-
176
-
177
-
178
-
179
-
180
-
181
-
182
-
183
-
184
-
185
-
186
-
187
-
188
-
189
-
190
-
191
-
192
-
193
-
194
-
195
-
196
-
197
-
198
-
199
-
200
-
201
-
202
-
203
-
204
-
205
-
206
-
207
-
208
-
209
-
210
-
211
-
212
-
213
-
214
-
215
-
216
-
217
-
218
-
219
-
220
 |
 |

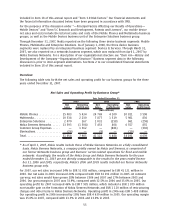
mobile devices were EUR 2.9 billion compared with EUR 2.7 billion in 2006. For 2007 and 2006, sales
and marketing costs represented approximately 8% of mobile device net sales. In an effort to
continue to improve our efficiency, we are targeting an improvement in the ratio of Nokia Group
gross margin to R&D expenses and an improvement in the ratio of Nokia Group gross margin to sales
and marketing expenses in 2008, compared to 2007.
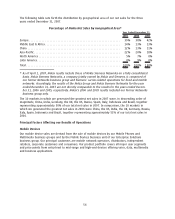
Infrastructure—Nokia Siemens Networks
Nokia Networks business was one of our business groups in the first quarter of 2007. On April 1,
2007, our Networks business group was combined with Siemens carrierrelated operations for fixed
and mobile networks to form Nokia Siemens Networks, a company jointly owned by Nokia and
Siemens and consolidated by Nokia. Accordingly, the results of Nokia Group and Nokia Siemens
Networks for periods from April 1, 2007 are not directly comparable to any prior period results. The
prior periods included our former Networks business group only.
Nokia Siemens Networks provides wireless and fixed network infrastructure, communications and
networks service platforms, as well as professional services, to operators and service providers. At the
end of 2007, Nokia Siemens Networks had approximately 58 500 employees, 1 400 customers in 150
countries, and systems serving in excess of one billion subscribers.
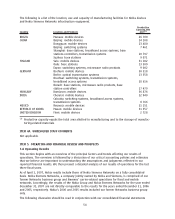
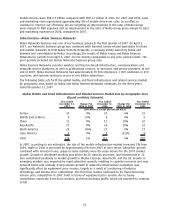
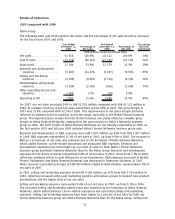
The following table sets forth the global mobile and fixed infrastructure and related services market
by geographic area, based on Nokia and Nokia Siemens Networks estimates, for the three years
ended December 31, 2007.
Global Mobile and Fixed Infrastructure and Related Services Market Size by Geographic Area
(Based on Nokia Estimate)
Year Ended
December 31,
2007
Change (%)
2006 to 2007
Year Ended
December 31,
2006
Change (%)
2005 to 2006
Year Ended
December 31,
2005
(EUR billions, except percentage data)
Europe .................. 33 0% 33 6% 31
Middle East & Africa. ....... 9 13% 8 0% 8
China ................... 11 0% 11 10% 10
AsiaPacific............... 27 4% 26 18% 22
North America ............ 26 (4)% 27 0% 27
Latin America ............ 8 0% 8 (11)% 9
Total.................... 114 1% 113 6% 107
In 2007, according to our estimates, the size of the mobile infrastructure market increased 1% from
2006, while in 2006 it increased by approximately 6% from 2005 in euro terms. Subscriber growth
combined with increased voice usage in some markets were the main drivers for the 2007 market
growth. Growth in developed markets was driven by 2G capacity increases, and investments in 3G
also contributed positively to market growth in Western Europe, AsiaPacific and the US. Growth in
emerging markets was impacted by rapid subscriber growth, resulting in capacity increases and new
network buildouts. Globally strong volume growth in networks infrastructure equipment was
significantly offset by equipment price erosion, largely as a result of a maturing of industry
technology, and intense price competition. The fixed line market continued to be characterized by
intense price competition in 2007, both in terms of equipment price erosion due to heavy
competition, especially from Asian vendors, and from declining tariffs, which are expected to continue
to fall.
61