Nokia 2007 Annual Report Download - page 58
Download and view the complete annual report
Please find page 58 of the 2007 Nokia annual report below. You can navigate through the pages in the report by either clicking on the pages listed below, or by using the keyword search tool below to find specific information within the annual report.-
 1
1 -
2
-
3
-
4
-
5
-
6
-
7
-
8
-
9
-
10
-
11
-
12
-
13
-
14
-
15
-
16
-
17
-
18
-
19
-
20
-
21
-
22
-
23
-
24
-
25
-
26
-
27
-
28
-
29
-
30
-
31
-
32
-
33
-
34
-
35
-
36
-
37
-
38
-
39
-
40
-
41
-
42
-
43
-
44
-
45
-
46
-
47
-
 48
48 -
 49
49 -
 50
50 -
 51
51 -
 52
52 -
 53
53 -
 54
54 -
 55
55 -
 56
56 -
 57
57 -
 58
58 -
 59
59 -
 60
60 -
 61
61 -
 62
62 -
 63
63 -
 64
64 -
 65
65 -
 66
66 -
 67
67 -
 68
68 -
69
-
70
-
71
-
72
-
73
-
74
-
75
-
76
-
77
-
78
-
79
-
80
-
81
-
82
-
83
-
84
-
85
-
86
-
87
-
88
-
89
-
90
-
91
-
92
-
93
-
94
-
95
-
96
-
97
-
98
-
99
-
100
-
101
-
102
-
103
-
104
-
105
-
106
-
107
-
108
-
109
-
110
-
111
-
112
-
113
-
114
-
115
-
116
-
117
-
118
-
119
-
120
-
121
-
122
-
123
-
124
-
125
-
126
-
127
-
128
-
129
-
130
-
131
-
132
-
133
-
134
-
135
-
136
-
137
-
138
-
139
-
140
-
141
-
142
-
143
-
144
-
145
-
146
-
147
-
148
-
149
-
150
-
151
-
152
-
153
-
154
-
155
-
156
-
157
-
158
-
159
-
160
-
161
-
162
-
163
-
164
-
165
-
166
-
167
-
168
-
169
-
170
-
171
-
172
-
173
-
174
-
175
-
176
-
177
-
178
-
179
-
180
-
181
-
182
-
183
-
184
-
185
-
186
-
187
-
188
-
189
-
190
-
191
-
192
-
193
-
194
-
195
-
196
-
197
-
198
-
199
-
200
-
201
-
202
-
203
-
204
-
205
-
206
-
207
-
208
-
209
-
210
-
211
-
212
-
213
-
214
-
215
-
216
-
217
-
218
-
219
-
220
 |
 |

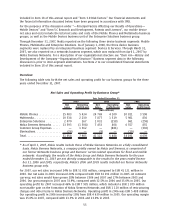
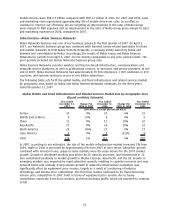
The following table sets forth our estimates for the global mobile device market volumes and
yearonyear growth rate by geographic area for the three years ended December 31, 2007.
Global Mobile Device Market Volume by Geographic Area
(Based on Nokia Estimates)
Year Ended
December 31,
2007
Change (%)
2006 to 2007
Year Ended
December 31,
2006
Change (%)
2005 to 2006
Year Ended
December 31,
2005
(Units in millions, except percentage data)
Europe .................. 284 3% 276 16% 238
Middle East & Africa. ....... 126 19% 106 68% 63
China ................... 173 34% 129 29% 100
AsiaPacific............... 254 34% 189 27% 149
North America ............ 170 6% 160 13% 142
Latin America ............ 130 10% 118 15% 103
Total.................... 1137 16% 978 23% 795
According to our estimates, in 2007 the global device market volume grew by 16% to 1 137 million
units, compared with an estimated 978 million units in 2006. This growth was driven primarily by the
strong growth in both replacement sales and sales from new subscribers in emerging markets,
particularly China, Middle East & Africa and emerging countries in AsiaPacific. Developed market
device volumes were driven primarily by replacement sales. In those markets, replacement was driven
primarily by device features such as color screens, cameras, music players, email, WCDMA and overall
aesthetics. We estimate that emerging markets accounted for almost 60% of industry device volumes
in 2007, compared with approximately 55% in 2006. The entrylevel device market has been an
important growth driver for the industry over the last few years, specifically the portion of that
market for devices priced at under 50 euros. This was particularly the case in 2007 where we
estimate this part of the market represented over 35% of the total industry volumes. We estimate the
converged device (smartphones) market was approximately 122 million units globally in 2007,
growing strongly from approximately 80 million units in 2006.
At the end of 2007, we estimate that there were approximately 3.3 billion mobile subscriptions
globally, representing approximately 43% global penetration. This is compared to approximately
2.7 billion mobile subscribers in 2006 and approximately 40% penetration.
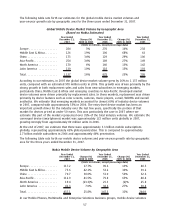
The following table sets forth our mobile device volumes and yearonyear growth rate by geographic
area for the three years ended December 31, 2007.
Nokia Mobile Device Volume by Geographic Area
Year Ended
December 31,
2007
Change (%)
2006 to 2007
Year Ended
December 31,
2006
Change (%)
2005 to 2006
Year Ended
December 31,
2005
(Units in millions, except percentage data)
Europe .................. 117.2 17.7% 99.6 13% 88.5
Middle East & Africa. ....... 75.6 42.1% 53.2 36% 39.2
China ................... 70.7 38.6% 51.0 56% 32.6
AsiaPacific............... 112.9 41.5% 79.8 65% 48.4
North America ............ 19.4 (23.3)% 25.3 (2)% 25.8
Latin America ............ 41.3 7.0% 38.6 27% 30.4
Total.................... 437.1 25.8% 347.5 31% 264.9
In our Mobile Phones, Multimedia and Enterprise Solutions business groups, mobile device volumes
57