Nokia 2007 Annual Report Download - page 74
Download and view the complete annual report
Please find page 74 of the 2007 Nokia annual report below. You can navigate through the pages in the report by either clicking on the pages listed below, or by using the keyword search tool below to find specific information within the annual report.-
 1
1 -
2
-
3
-
4
-
5
-
6
-
7
-
8
-
9
-
10
-
11
-
12
-
13
-
14
-
15
-
16
-
17
-
18
-
19
-
20
-
21
-
22
-
23
-
24
-
25
-
26
-
27
-
28
-
29
-
30
-
31
-
32
-
33
-
34
-
35
-
36
-
37
-
38
-
39
-
40
-
41
-
42
-
43
-
44
-
45
-
46
-
47
-
48
-
49
-
50
-
51
-
52
-
53
-
54
-
55
-
56
-
57
-
58
-
59
-
60
-
61
-
62
-
63
-
 64
64 -
 65
65 -
 66
66 -
 67
67 -
 68
68 -
 69
69 -
 70
70 -
 71
71 -
 72
72 -
 73
73 -
 74
74 -
 75
75 -
 76
76 -
 77
77 -
 78
78 -
 79
79 -
 80
80 -
 81
81 -
 82
82 -
 83
83 -
 84
84 -
85
-
86
-
87
-
88
-
89
-
90
-
91
-
92
-
93
-
94
-
95
-
96
-
97
-
98
-
99
-
100
-
101
-
102
-
103
-
104
-
105
-
106
-
107
-
108
-
109
-
110
-
111
-
112
-
113
-
114
-
115
-
116
-
117
-
118
-
119
-
120
-
121
-
122
-
123
-
124
-
125
-
126
-
127
-
128
-
129
-
130
-
131
-
132
-
133
-
134
-
135
-
136
-
137
-
138
-
139
-
140
-
141
-
142
-
143
-
144
-
145
-
146
-
147
-
148
-
149
-
150
-
151
-
152
-
153
-
154
-
155
-
156
-
157
-
158
-
159
-
160
-
161
-
162
-
163
-
164
-
165
-
166
-
167
-
168
-
169
-
170
-
171
-
172
-
173
-
174
-
175
-
176
-
177
-
178
-
179
-
180
-
181
-
182
-
183
-
184
-
185
-
186
-
187
-
188
-
189
-
190
-
191
-
192
-
193
-
194
-
195
-
196
-
197
-
198
-
199
-
200
-
201
-
202
-
203
-
204
-
205
-
206
-
207
-
208
-
209
-
210
-
211
-
212
-
213
-
214
-
215
-
216
-
217
-
218
-
219
-
220
 |
 |

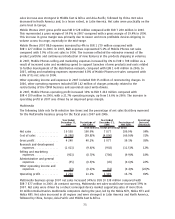
sales increase was strongest in Middle East & Africa and AsiaPacific, followed by China. Net sales
decreased in North America and, to a lesser extent, in Latin America. Net sales were practically on the
same level in Europe.
Mobile Phones 2007 gross profit was EUR 8 528 million compared with EUR 7 280 million in 2006.
This represented a gross margin of 34.0% in 2007 compared with a gross margin of 29.4% in 2006.
This increase in gross margin was primarily due to newer and more profitable devices shipping in
volume across its range, especially in the midrange.
Mobile Phones 2007 R&D expenses increased by 4% to EUR 1 270 million compared with
EUR 1 227 million in 2006. In 2007, R&D expenses represented 5.1% of Mobile Phones net sales
compared with 5.0% of its net sales in 2006. The increase reflected the extensive renewal of the
product portfolio and continuous introduction of new features in the products shipping in volumes.
In 2007, Mobile Phones selling and marketing expenses increased by 4% to EUR 1 708 million as a
result of increased sales and marketing spend to support launches of new products and costs related
to further development of the distribution network, compared with EUR 1 649 million in 2006. In
2007, selling and marketing expenses represented 6.8% of Mobile Phones net sales compared with
6.6% of its net sales in 2006.
Other operating income and expenses in 2007 included EUR 35 million of restructuring charges. In
2006, other operating expenses included EUR 142 million of charges primarily related to the
restructuring of the CDMA business and associated asset writedowns.
In 2007, Mobile Phones operating profit increased 33% to EUR 5 434 million compared with
EUR 4 100 million in 2006, with a 21.7% operating margin, up from 16.6% in 2006. The increase in
operating profit in 2007 was driven by an improved gross margin.
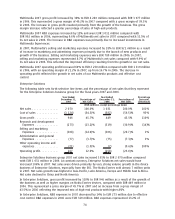
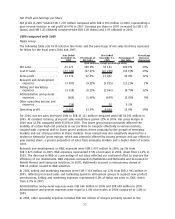
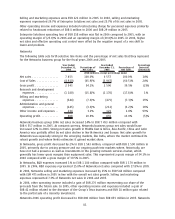
Multimedia
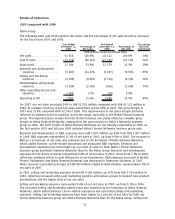
The following table sets forth selective line items and the percentage of net sales that they represent
for the Multimedia business group for the fiscal years 2007 and 2006.
Year Ended
December 31,
2007
Percentage of
Net Sales
Year Ended
December 31,
2006
Percentage of
Net Sales
Percentage
Increase/
(Decrease)
(EUR millions, except percentage data)
Net sales ................. 10538 100.0% 7 877 100.0% 34%
Cost of sales .............. (6298) (59.8)% (4 800) (60.9)% 31%
Gross profit ............... 4240 40.2% 3 077 39.1% 38%
Research and development
expenses ............... (1011) (9.6)% (902) (11.5)% 12%
Selling and marketing
expenses ............... (921) (8.7)% (780) (9.9)% 18%
Administrative and general
expenses ............... (55) (0.5)% (45) (0.6)% 22%
Other operating income and
expenses ............... (23) (0.2)% (31) (0.4)% (26)%
Operating profit............ 2230 21.2% 1 319 16.7% 69%
Multimedia business group 2007 net sales increased 34% to EUR 10 538 million compared with
EUR 7 877 million in 2006. At constant currency, Multimedia net sales would have increased 39% in
2007. Net sales were driven by a robust converged device market supporting sales of more than
38 million Nokia Nseries multimedia computers during the year, led by the Nokia N70, Nokia N73 and
Nokia N95. Net sales increased in all regions and were strongest in Latin America and North America,
followed by China, Europe, AsiaPacific and Middle East & Africa.
73