Nokia 2007 Annual Report Download - page 60
Download and view the complete annual report
Please find page 60 of the 2007 Nokia annual report below. You can navigate through the pages in the report by either clicking on the pages listed below, or by using the keyword search tool below to find specific information within the annual report.-
 1
1 -
2
-
3
-
4
-
5
-
6
-
7
-
8
-
9
-
10
-
11
-
12
-
13
-
14
-
15
-
16
-
17
-
18
-
19
-
20
-
21
-
22
-
23
-
24
-
25
-
26
-
27
-
28
-
29
-
30
-
31
-
32
-
33
-
34
-
35
-
36
-
37
-
38
-
39
-
40
-
41
-
42
-
43
-
44
-
45
-
46
-
47
-
48
-
49
-
 50
50 -
 51
51 -
 52
52 -
 53
53 -
 54
54 -
 55
55 -
 56
56 -
 57
57 -
 58
58 -
 59
59 -
 60
60 -
 61
61 -
 62
62 -
 63
63 -
 64
64 -
 65
65 -
 66
66 -
 67
67 -
 68
68 -
 69
69 -
 70
70 -
71
-
72
-
73
-
74
-
75
-
76
-
77
-
78
-
79
-
80
-
81
-
82
-
83
-
84
-
85
-
86
-
87
-
88
-
89
-
90
-
91
-
92
-
93
-
94
-
95
-
96
-
97
-
98
-
99
-
100
-
101
-
102
-
103
-
104
-
105
-
106
-
107
-
108
-
109
-
110
-
111
-
112
-
113
-
114
-
115
-
116
-
117
-
118
-
119
-
120
-
121
-
122
-
123
-
124
-
125
-
126
-
127
-
128
-
129
-
130
-
131
-
132
-
133
-
134
-
135
-
136
-
137
-
138
-
139
-
140
-
141
-
142
-
143
-
144
-
145
-
146
-
147
-
148
-
149
-
150
-
151
-
152
-
153
-
154
-
155
-
156
-
157
-
158
-
159
-
160
-
161
-
162
-
163
-
164
-
165
-
166
-
167
-
168
-
169
-
170
-
171
-
172
-
173
-
174
-
175
-
176
-
177
-
178
-
179
-
180
-
181
-
182
-
183
-
184
-
185
-
186
-
187
-
188
-
189
-
190
-
191
-
192
-
193
-
194
-
195
-
196
-
197
-
198
-
199
-
200
-
201
-
202
-
203
-
204
-
205
-
206
-
207
-
208
-
209
-
210
-
211
-
212
-
213
-
214
-
215
-
216
-
217
-
218
-
219
-
220
 |
 |
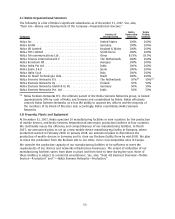
on market share and pricing. The Business Week and Interbrand annual rating of 2007 Best Global
Brands positioned Nokia as the fifth mostvalued brand in the world.
At the end of 2007, we made over 1.5 million devices per day in our 10 main device manufacturing
facilities globally. We also enjoy a worldclass logistics and distribution system and in 2007, we were
ranked the number one company in the world in supply chain management by AMR Research. In
terms of technology, we believe we need to develop, master, integrate and own relevant technology.
This allows us to drive down manufacturing costs and also benefit from technology evolutions and
discontinuities in terms of margin and market share.
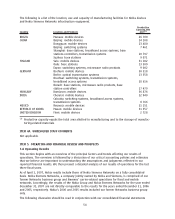
In August 2007, we announced that we were introducing a multisourcing model for our chipsets.
Under the revised strategy, we are discontinuing parts of our own chipset R&D and have expanded
our use of commercially available chipsets to four suppliers. We are, however, continuing to develop
our leading modem technology, which includes protocol software and related digital design for multi
protocol modems. The revised strategy is aimed at increasing the efficiency of our R&D efforts by
allowing us to leverage external innovation through working with the best partners in a specific
chipset development area, and by freeing our own R&D resources to focus on our core competencies
in modem development and other areas central to our growth strategy, mainly consumer Internet
services and enterprise software.
Our broad product portfolio allows us to serve all the relevant segments of the market. Quality is
extremely important to consumers and to Nokia. Having high quality products is important because it
is one of the key determinants for consumer purchasing behavior and also a critical element in
managing costs effectively. Finally, of critical importance, competitiveness in our industry requires
significant R&D investments, with IPRs filed to protect those investments and related inventions.
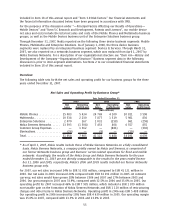
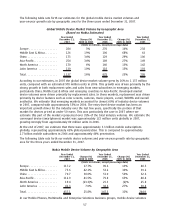
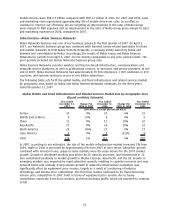
Our device net sales are driven by factors such as the global mobile device market volumes, the value
of the mobile device market, our market share development and our ASP.
The global mobile device market volume is driven by the number of new subscribers (net adds) and
the degree to which existing mobile subscribers replace their mobile devices with new devices. New
subscriber growth, particularly in emerging markets, is impacted primarily by lower cost of
ownership, driven by lower priced tariffs and lower cost mobile devices. The replacement market is
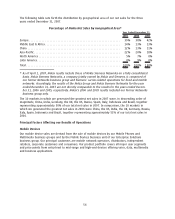
driven by the introduction of devices that are attractive to endusers in terms of design, features,
functionality and aesthetics. We estimate that the replacement market will continue to represent over
70% of the device industry volumes in 2008, compared with just under 70% in 2007. In 2008, we
expect the most important drivers of the replacement market will continue to be purchases of devices
with color screens, cameras, music players, converged multimedia applications, WCDMA and other
general aesthetic features. We also expect that email and navigation capability will be increasingly
significant drivers of the replacement market in 2008. Replacement volumes in the emerging markets
are having an increasingly significant impact on the global market. We estimate in emerging markets,
replacements accounted for over 50% of total mobile device volumes in 2007, and we expect it to be
over 60% in 2008. We are also seeing anecdotal evidence that some consumers in the emerging
markets are upgrading to higherpriced devices when they replace their devices.
Industry volume growth is also influenced by, among other factors, global and regional economic
factors, regional political environment, consumer spending patterns, competitive pressures, regulatory
environments, the timing and success of product and service introductions by various market
participants, including mobile network operators, the commercial acceptance of new mobile devices,
technologies and services, the convergence of technologies in mobile devices and operators’ and
distributors’ financial situations. Industry volumes are also affected by the level of mobile device
subsidies that mobile network operators are willing to offer to endusers in the markets where
subsidies are prevalent.
We expect industry mobile device volumes in 2008 to grow by approximately 10% from the
approximately 1.14 billion units we estimate for 2007. We expect the volume growth in 2008 to be
above 15% in AsiaPacific, China and Middle East & Africa, and below 10% in Europe, Latin America
59