Nokia 2007 Annual Report Download - page 192
Download and view the complete annual report
Please find page 192 of the 2007 Nokia annual report below. You can navigate through the pages in the report by either clicking on the pages listed below, or by using the keyword search tool below to find specific information within the annual report.-
 1
1 -
2
-
3
-
4
-
5
-
6
-
7
-
8
-
9
-
10
-
11
-
12
-
13
-
14
-
15
-
16
-
17
-
18
-
19
-
20
-
21
-
22
-
23
-
24
-
25
-
26
-
27
-
28
-
29
-
30
-
31
-
32
-
33
-
34
-
35
-
36
-
37
-
38
-
39
-
40
-
41
-
42
-
43
-
44
-
45
-
46
-
47
-
48
-
49
-
50
-
51
-
52
-
53
-
54
-
55
-
56
-
57
-
58
-
59
-
60
-
61
-
62
-
63
-
64
-
65
-
66
-
67
-
68
-
69
-
70
-
71
-
72
-
73
-
74
-
75
-
76
-
77
-
78
-
79
-
80
-
81
-
82
-
83
-
84
-
85
-
86
-
87
-
88
-
89
-
90
-
91
-
92
-
93
-
94
-
95
-
96
-
97
-
98
-
99
-
100
-
101
-
102
-
103
-
104
-
105
-
106
-
107
-
108
-
109
-
110
-
111
-
112
-
113
-
114
-
115
-
116
-
117
-
118
-
119
-
120
-
121
-
122
-
123
-
124
-
125
-
126
-
127
-
128
-
129
-
130
-
131
-
132
-
133
-
134
-
135
-
136
-
137
-
138
-
139
-
140
-
141
-
142
-
143
-
144
-
145
-
146
-
147
-
148
-
149
-
150
-
151
-
152
-
153
-
154
-
155
-
156
-
157
-
158
-
159
-
160
-
161
-
162
-
163
-
164
-
165
-
166
-
167
-
168
-
169
-
170
-
171
-
172
-
173
-
174
-
175
-
176
-
177
-
178
-
179
-
180
-
181
-
 182
182 -
 183
183 -
 184
184 -
 185
185 -
 186
186 -
 187
187 -
 188
188 -
 189
189 -
 190
190 -
 191
191 -
 192
192 -
 193
193 -
 194
194 -
 195
195 -
 196
196 -
 197
197 -
 198
198 -
 199
199 -
 200
200 -
 201
201 -
 202
202 -
203
-
204
-
205
-
206
-
207
-
208
-
209
-
210
-
211
-
212
-
213
-
214
-
215
-
216
-
217
-
218
-
219
-
220
 |
 |

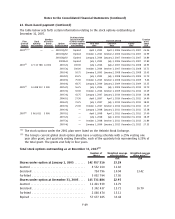
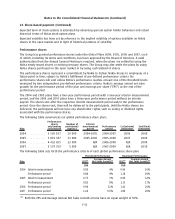
22. Sharebased payment (Continued)
The table below sets forth certain information relating to the stock options outstanding at
December 31, 2007.
Plan
(year of
launch)
Stock
options
outstanding
Number
of partici
pants
(approx.)
Option
(sub)category
Vesting status
(as percentage
of total number
of stock options
outstanding)
First vest
date
Last vest
date
Expiry
date
Exercise
price/
share
EUR
Exercise period
2001
(1),(2)
— — 2001C1Q/02 Expired April 1, 2003 April 3, 2006 December 31, 2007 26.06
2001C3Q/02 Expired October 1, 2003 October 2, 2006 December 31, 2007 12.99
2001C4Q/02 Expired January 2, 2004 January 2, 2007 December 31, 2007 16.86
2002A+B Expired July 1, 2003 July 3, 2006 December 31, 2007 17.89
2003
(2)
17 113 788 14 000 2003 2Q 100.00 July 1, 2004 July 2, 2007 December 31, 2008 14.95
2003 3Q 100.00 October 1, 2004 October 1, 2007 December 31, 2008 12.71
2003 4Q 93.75 January 3, 2005 January 2, 2008 December 31, 2008 15.05
2004 2Q 81.25 July 1, 2005 July 1, 2008 December 31, 2009 11.79
2004 3Q 75.00 October 3, 2005 October 1, 2008 December 31, 2009 9.44
2004 4Q 68.75 January 2, 2006 January 2, 2009 December 31, 2009 12.35
2005
(2)
14 498 513 5 000 2005 2Q 56.25 July 1, 2006 July 1, 2009 December 31, 2010 12.79
2005 3Q 50.00 October 1, 2006 October 1, 2009 December 31, 2010 13.09
2005 4Q 43.75 January 1, 2007 January 1, 2010 December 31, 2010 14.48
2006 1Q 37.50 April 1, 2007 April 1, 2010 December 31, 2011 14.99
2006 2Q 31.25 July 1, 2007 July 1, 2010 December 31, 2011 18.02
2006 3Q 25.00 October 1, 2007 October 1, 2010 December 31, 2011 15.37
2006 4Q — January 1, 2008 January 1, 2011 December 31, 2011 15.38
2007
(2)
3 061 011 3 000 2007 1Q — April 1, 2008 April 1, 2011 December 31, 2011 17.00
2007 2Q — July 1, 2008 July 1, 2011 December 31, 2012 18.39
2007 3Q — October 1, 2008 October 1, 2011 December 31, 2012 21.86
2007 4Q — January 1, 2009 January 1, 2012 December 31, 2012 27.53
(1)
The stock options under the 2001 plan were listed on the Helsinki Stock Exchange.
(2)
The Group’s current global stock option plans have a vesting schedule with a 25% vesting one
year after grant, and quarterly vesting thereafter, each of the quarterly lots representing 6.25% of
the total grant. The grants vest fully in four years.
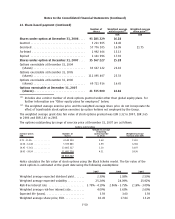
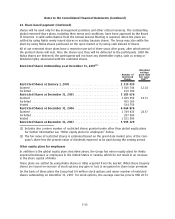
Total stock options outstanding as at December 31, 2007
(1)
Number of
shares
Weighted average
exercise price
Weighted average
share price
(2)
EUR EUR
Shares under option at January 1, 2005 ....... 142 957 316 23.29
Granted ................................... 8552160 12.82
Exercised .................................. 724796 10.94 13.42
Forfeited .................................. 5052794 17.86
Shares under option at December 31, 2005 .... 145 731 886 22.97
Granted ................................... 11421939 16.79
Exercised .................................. 3302437 13.71 16.70
Forfeited .................................. 2888474 15.11
Expired ................................... 57677685 33.44
F49
Notes to the Consolidated Financial Statements (Continued)