Nikon 2003 Annual Report Download - page 3
Download and view the complete annual report
Please find page 3 of the 2003 Nikon annual report below. You can navigate through the pages in the report by either clicking on the pages listed below, or by using the keyword search tool below to find specific information within the annual report.-
 1
1 -
 2
2 -
 3
3 -
 4
4 -
 5
5 -
 6
6 -
 7
7 -
 8
8 -
 9
9 -
 10
10 -
 11
11 -
 12
12 -
 13
13 -
 14
14 -
15
-
16
-
17
-
18
-
19
-
20
-
21
-
22
-
23
-
24
-
25
-
26
-
27
-
28
-
29
-
30
-
31
-
32
-
33
-
34
-
35
-
36
-
37
-
38
-
39
-
40
-
41
-
42
-
43
-
44
-
45
-
46
 |
 |

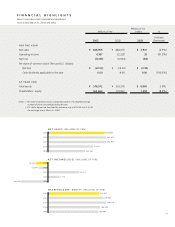
162, 4 6 4
NikonCorporationandConsolidatedSubsidiaries
YearsendedMarch31,2003and2002
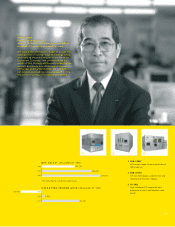
F I N A N C I A L H I G H L I G H T S
N E T S A L E S ( M I L L I O N S O F Y E N )
N E T I N C O M E ( L O S S ) ( M I L L I O N S O F Y E N )
S H A R E H O L D E R S ’ E Q U I T Y ( M I L L I O N S O F Y E N )
468,959
482,975
483,957
371,8 01
30 5,765
20,911
7,770
176,9 61
186 ,119
166,49 5
160,9 91
MillionsofYen
MillionsofU.S.
Dollars %
Increase
(Decrease)
F O R T H E Y E A R
Netsales ¥ 468,959 ¥ 482,975 $ 3,901 (2.9%)
Operatingincome 4,187 22,239 35 (81.2%)
Netloss (8,143) (6,004) (68)
Pershareofcommonstock(YenandU.S.dollars):
Netloss ¥ (22.03) ¥ (16.23) $ (0.18)
Cashdividendsapplicabletotheyear 0.00 4.00 0.00 (100.0%)
AT Y E A R - E N D
Totalassets ¥ 576,912 ¥ 561,276 $ 4,800 2.8%
Shareholders’equity 162,464 176,961 1,352 (8.2%)
Notes:1.Pershareofcommonstockiscomputedbasedontheweightedaverage
numberofsharesoutstandingduringtheyear.
2.U.S.dollarguresaretranslatedforreferenceonlyat¥120.20toU.S.$1.00,
theexchangerateatMarch31,2003.
20 03
20 02
20 01
20 0 0
199 9
20 03
20 02
20 01
20 0 0
199 9
( 8 ,14 3 )
( 6 ,0 0 4 )
(18, 2 33 )
20 03
20 02
20 01
20 0 0
199 9
2003 2002 2003
0 1