Nikon 2003 Annual Report Download - page 20
Download and view the complete annual report
Please find page 20 of the 2003 Nikon annual report below. You can navigate through the pages in the report by either clicking on the pages listed below, or by using the keyword search tool below to find specific information within the annual report.-
 1
1 -
2
-
3
-
4
-
5
-
6
-
7
-
8
-
9
-
 10
10 -
 11
11 -
 12
12 -
 13
13 -
 14
14 -
 15
15 -
 16
16 -
 17
17 -
 18
18 -
 19
19 -
 20
20 -
 21
21 -
 22
22 -
 23
23 -
 24
24 -
 25
25 -
 26
26 -
 27
27 -
 28
28 -
 29
29 -
 30
30 -
31
-
32
-
33
-
34
-
35
-
36
-
37
-
38
-
39
-
40
-
41
-
42
-
43
-
44
-
45
-
46
 |
 |

18
OPERATIONAL REVIEW AND ANALYSIS
During the year, the Nikon Group worked hard to fortify the Group earnings structure. Besides an attempt to trim headcount through an
expanded early retirement program for employees, efforts focused on liquidating unprofitable subsidiaries and on cost-reduction initiatives to
lower costs further. While continuing to expand the overseas network of production and service bases, the Group also sought to develop new
businesses based on proprietary technology and to complete timely launches of new products. Consolidated net sales totaled ¥469.0 billion,
a decline of ¥14.0 billion, or 2.9%, relative to the previous year. The Nikon Group recorded a consolidated net loss of ¥8.1 billion for the year.
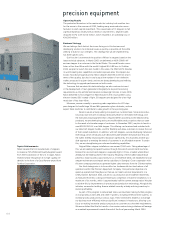
Breaking down results by business segment, Precision Equipment posted ¥133.1 billion in net sales, a year-on-year decrease of 33.1%, and
an operating loss of ¥24.6 billion. Sales of IC steppers declined as the markets in both Japan and the United States contracted, while sales of
LCD steppers fell sharply in volume terms as manufacturers cut capital spending related to the production of smaller LCD panels. Imaging
Products benefited from continued rapid growth in the digital camera market, posting an increase in net sales of 22.7% to ¥272.0 billion,
alongside operating income of ¥27.7 billion. Instruments recorded net sales of ¥49.9 billion, a 6.9% gain relative to the previous year, as sales
of instruments rose across the board. Segment operating income amounted to ¥1.8 billion.
Breaking down results by geographic segment, sales rose in Japan as growth generated by newly launched models in the digital camera
market offset the reduction in sales due to the harsh business conditions caused by an ongoing downturn in the semiconductor market.
Although sales in Japan increased by 6.5% to ¥398.6 billion, an operating loss of ¥7.2 billion was recorded. Overseas, despite steady growth
in sales of digital cameras, sales in North America plunged 22.1% to ¥160.4 billion as the semiconductor market downturn had a pronounced
impact on sales. Operating income dipped to ¥5.7 billion. In Europe, although sales of steppers declined, strong growth in sales of digital
cameras resulted in a year-on-year increase in sales of 20.9%, to ¥100.8 billion. Even so, the region posted an operating loss of ¥0.4 billion.
In Asia, sharply increased sales promotion expenses pushed up operating costs, which blunted the impact of higher sales of digital imaging
products. Regional sales rose 13.3% to ¥45.2 billion, generating operating income of ¥2.6 billion.
Income Analysis
Years ended March 31, 2003 and 2002
Net sales
Cost of sales
Gross profit
SG&A expenses
Operating income
Net interest expense and dividend income
Net other expenses
Income (loss) before income taxes and minority interest
Income taxes
Minority interest
Net loss
Note: All expenses and subtractive amounts are in parentheses.
2002
100.0%
(63.5)
36.5
(31.9)
4.6
(0.5)
(3.5)
0.6
(1.8)
(0.0)
(1.2)
2003
100.0%
(65.6)
34.4
(33.5)
0.9
(0.3)
(2.9)
(2.3)
0.6
(0.0)
(1.7)
(% of Net Sales)
Balance Sheet Analysis
March 31, 2003 and 2002
Total assets
Total current assets
Inventories
Property, plant and equipment
Investments and other assets
Total current liabilities
Short-term borrowings
Long-term debt, less current portion
Shareholders’ equity
2002
100.0%
65.5
37.1
20.2
14.3
50.0
19.9
14.5
31.5
2003
100.0%
67.3
39.3
19.2
13.5
44.1
10.4
27.7
28.2
(% of Total Assets)