Nikon 2003 Annual Report Download - page 19
Download and view the complete annual report
Please find page 19 of the 2003 Nikon annual report below. You can navigate through the pages in the report by either clicking on the pages listed below, or by using the keyword search tool below to find specific information within the annual report.-
 1
1 -
2
-
3
-
4
-
5
-
6
-
7
-
8
-
 9
9 -
 10
10 -
 11
11 -
 12
12 -
 13
13 -
 14
14 -
 15
15 -
 16
16 -
 17
17 -
 18
18 -
 19
19 -
 20
20 -
 21
21 -
 22
22 -
 23
23 -
 24
24 -
 25
25 -
 26
26 -
 27
27 -
 28
28 -
 29
29 -
30
-
31
-
32
-
33
-
34
-
35
-
36
-
37
-
38
-
39
-
40
-
41
-
42
-
43
-
44
-
45
-
46
 |
 |

17
For the year
Net sales
Cost of sales
SG&A expenses
Operating income (loss)
Income (loss) before income taxes and minority interest
Net income (loss)
Per share of common stock (Yen and U.S. dollars):
Net income (loss)
Cash dividends applicable to the year
Capital expenditures
Depreciation and amortization
R&D costs
At year-end
Total assets
Shareholders’ equity
Notes: 1. Per share of common stock is computed based on the weighted average number of shares outstanding during the year.
2. U.S. dollar figures are translated for reference only at ¥120.20 to U.S. $1.00, the exchange rate at March 31, 2003.
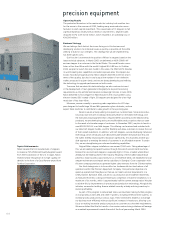
OPERATING ENVIRONMENT
In the fiscal year ended March 31, 2003, the slowdown in the U.S. economy became more pronounced as growth in consumer spending
tapered off. European economies also continued to stagnate amid generally poor export conditions. In contrast, Asia experienced a mild
economic expansion, with growth still vigorous in China.
In Japan, persistently lackluster consumer spending combined with depressed levels of capital investment, housing investment and
public-works spending. Harsh business conditions continued to prevail.
The ongoing downturn in the market for semiconductors continued to have a negative impact on both the Precision Equipment and
Instruments segments of the Nikon Group business, resulting in extremely poor business conditions. In contrast, the Imaging Products segment
benefited from the continued expansion of the digital camera market.
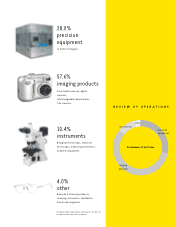
Precision Equipment
Share of net sales
Imaging Products
Share of net sales
Instruments
Share of net sales
Other
Share of net sales
Tota l
(Elimination)
Consolidated
Net Sales by Industry Segment
Years ended March 31, 2003 and 2002
FIVE-YEAR SUMMARY
Nikon Corporation and Consolidated Subsidiaries
Years ended March 31
Thousands of
U.S. Dollars
2003
$3,901,487
2,558,264
1,308,396
34,827
(92,578)
(67,744)
$(0.18)
0.00
$168,265
170,010
228,832
$4,799,597
1,351,608
1999
¥305,765
205,984
108,522
(8,741)
(17,447)
(18,233)
¥(49.29)
3.00
¥20,719
20,110
18,729
¥474,965
160,991
2000
¥371,801
247,473
105,894
18,434
11,479
7,770
¥21.01
5.00
¥13,881
17,251
17,798
¥502,175
166,495
2001
¥483,957
301,759
120,775
61,423
29,827
20,911
¥56.53
8.00
¥25,996
16,007
22,794
¥593,454
186,119
2002
¥482,975
306,793
153,943
22,239
2,755
(6,004)
¥(16.23)
4.00
¥33,546
17,917
27,313
¥561,276
176,961
2003
¥468,959
307,503
157,269
4,187
(11,128)
(8,143)
¥(22.03)
0.00
¥20,226
20,435
27,506
¥576,912
162,464
Millions of Yen
MANAGEMENT’S DISCUSSION AND ANALYSIS OF OPERATIONS
Thousands of
U.S. Dollars
2003
$1,107,336
2,262,527
414,905
348,380
$4,133,148
(231,661)
$3,901,487
2002
¥198,991
41.2%
221,577
45.9
46,641
9.6
48,176
10.0
¥515,385
(32,410)
(6.7)
¥482,975
2003
¥133,102
28.4%
271,956
58.0
49,872
10.6
41,875
8.9
¥496,805
(27,846)
(5.9)
¥468,959
Millions of Yen, %