National Grid 2011 Annual Report Download - page 76
Download and view the complete annual report
Please find page 76 of the 2011 National Grid annual report below. You can navigate through the pages in the report by either clicking on the pages listed below, or by using the keyword search tool below to find specific information within the annual report.-
 1
1 -
2
-
3
-
4
-
5
-
6
-
7
-
8
-
9
-
10
-
11
-
12
-
13
-
14
-
15
-
16
-
17
-
18
-
19
-
20
-
21
-
22
-
23
-
24
-
25
-
26
-
27
-
28
-
29
-
30
-
31
-
32
-
33
-
34
-
35
-
36
-
37
-
38
-
39
-
40
-
41
-
42
-
43
-
44
-
45
-
46
-
47
-
48
-
49
-
50
-
51
-
52
-
53
-
54
-
55
-
56
-
57
-
58
-
59
-
60
-
61
-
62
-
63
-
64
-
65
-
 66
66 -
 67
67 -
 68
68 -
 69
69 -
 70
70 -
 71
71 -
 72
72 -
 73
73 -
 74
74 -
 75
75 -
 76
76 -
 77
77 -
 78
78 -
 79
79 -
 80
80 -
 81
81 -
 82
82
 |
 |
74 National Grid Gas plc Annual Report and Accounts 2010/11
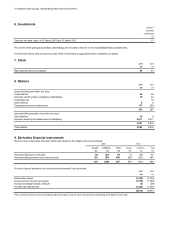
6. Investments
Shares in
subsidiary
undertakings
£m
Cost and net book value at 31 March 2010 and 31 March 2011 17
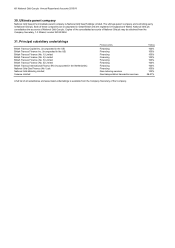
The names of the principal subsidiary undertakings are included in note 31 to the consolidated financial statements.
The directors believe that the carrying value of the investments is supported by their underlying net assets.
7. Stock
2011 2010
£m £m
Raw materials and consumables 40 43
8. Debtors
2011 2010
£m £m
A
mounts falling due within one year:
Trade debtors 36 58
A
mounts owed by fellow subsidiary undertakings 15 24
Corporation tax -10
Other debtors 85
Prepayments and accrued income 173 200
232 297
A
mounts falling due after more than one year:
Other debtors 10 8
A
mounts owed by immediate parent undertaking 5,611 5,611
5,621 5,619
Total debtors 5,853 5,916
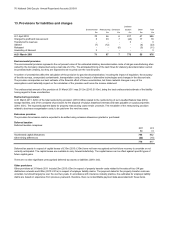
9. Derivative financial instruments
The fair value of derivative financial instruments shown on the balance sheet is as follows:
Assets Liabilities Total Assets Liabilities Total
£m £m £m £m £m £m
A
mounts falling due in one year 80 (22) 58 72 (30) 42
A
mounts falling due after more than one year 535 (86) 449 565 (121) 444
615 (108) 507 637 (151) 486
2011 2010
£m £m
Interest rate swaps (5,199) (3,154)
Cross-currency interest rate swaps (1,578) (1,748)
Foreign exchange forward contracts (4) (39)
Forward rate agreements (1,832) (1,730)
(8,613) (6,671)
*The notional contract amounts of derivatives indicate the gross nominal value of transactions outstanding at the balance sheet date
For each class of derivative the notional contract amounts* are as follows:
2011 2010