National Grid 2011 Annual Report Download - page 57
Download and view the complete annual report
Please find page 57 of the 2011 National Grid annual report below. You can navigate through the pages in the report by either clicking on the pages listed below, or by using the keyword search tool below to find specific information within the annual report.-
 1
1 -
2
-
3
-
4
-
5
-
6
-
7
-
8
-
9
-
10
-
11
-
12
-
13
-
14
-
15
-
16
-
17
-
18
-
19
-
20
-
21
-
22
-
23
-
24
-
25
-
26
-
27
-
28
-
29
-
30
-
31
-
32
-
33
-
34
-
35
-
36
-
37
-
38
-
39
-
40
-
41
-
42
-
43
-
44
-
45
-
46
-
 47
47 -
 48
48 -
 49
49 -
 50
50 -
 51
51 -
 52
52 -
 53
53 -
 54
54 -
 55
55 -
 56
56 -
 57
57 -
 58
58 -
 59
59 -
 60
60 -
 61
61 -
 62
62 -
 63
63 -
 64
64 -
 65
65 -
 66
66 -
 67
67 -
68
-
69
-
70
-
71
-
72
-
73
-
74
-
75
-
76
-
77
-
78
-
79
-
80
-
81
-
82
 |
 |

National Grid Gas plc Annual Report and Accounts 2010/11 55
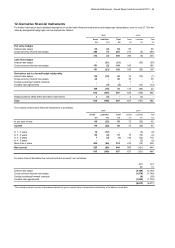
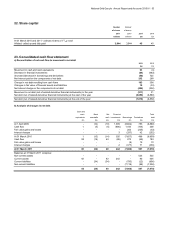
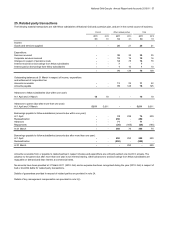
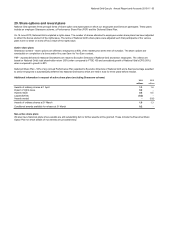
22. Share capital
Number Number
of shares of shares
2011 2010 2011 2010
millions millions £m £m
A
t 31 March 2010 and 2011 - ordinar
y
shares of 1
2
/
15
p each
3,944 3,944 45 45
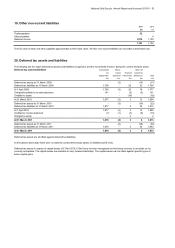
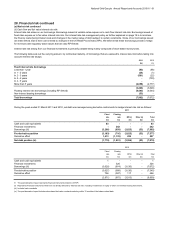
23. Consolidated cash flow statement
a) Reconciliation of net cash flow to movement in net deb
t
2011 2010
£m £m
Movement in cash and cash equivalents 63 (4)
Decrease in financial investments (84) (683)
(Increase)/decrease in borrowings and derivatives (58) 725
Net interest paid on the components of net debt 262 268
Change in net debt resulting from cash flows 183 306
Changes in fair value of financial assets and liabilities 10 (33)
Net interest charge on the components of net debt (404) (252)
Movement in net debt (net of related derivative financial instruments) in the year (211) 21
Net debt (net of related derivative financial instruments) at the start of the year (6,859) (6,880)
Net debt (net of related derivative financial instruments) at the end of the year (7,070) (6,859)
b) Analysis of changes in net deb
t
Cash and
cash Bank Net Financial Total
equivalents overdrafts cash investments Borrowings Derivatives debt
£m £m £m £m £m £m £m
A
t 1 April 2009 - (10) (10) 1,009 (8,662) 783 (6,880)
Cash flo
w
1 (5) (4) (686) 1,100 (104) 306
Fair value gains and losses - - - - 202 (235) (33)
Interest charges - - - 3 (297) 42 (252)
A
t 31 March 2010 1 (15) (14) 326 (7,657) 486 (6,859)
Cash flo
w
82 (19) 63 (86) 275 (69) 183
Fair value gains and losses - - - - (9) 19 10
Interest charges - - - 2 (477) 71 (404)
At 31 March 2011 83 (34) 49 242 (7,868) 507 (7,070)
Balances at 31 March 2011 comprise:
Non-current assets - ----535535
Current assets 83 - 83 242 - 80 405
Current liabilities - (34) (34) - (750) (22) (806)
Non-current liabilities - - - - (7,118) (86) (7,204)
83 (34) 49 242 (7,868) 507 (7,070)
Allotted, called up and fully paid