National Grid 2011 Annual Report Download - page 63
Download and view the complete annual report
Please find page 63 of the 2011 National Grid annual report below. You can navigate through the pages in the report by either clicking on the pages listed below, or by using the keyword search tool below to find specific information within the annual report.-
 1
1 -
2
-
3
-
4
-
5
-
6
-
7
-
8
-
9
-
10
-
11
-
12
-
13
-
14
-
15
-
16
-
17
-
18
-
19
-
20
-
21
-
22
-
23
-
24
-
25
-
26
-
27
-
28
-
29
-
30
-
31
-
32
-
33
-
34
-
35
-
36
-
37
-
38
-
39
-
40
-
41
-
42
-
43
-
44
-
45
-
46
-
47
-
48
-
49
-
50
-
51
-
52
-
 53
53 -
 54
54 -
 55
55 -
 56
56 -
 57
57 -
 58
58 -
 59
59 -
 60
60 -
 61
61 -
 62
62 -
 63
63 -
 64
64 -
 65
65 -
 66
66 -
 67
67 -
 68
68 -
 69
69 -
 70
70 -
 71
71 -
 72
72 -
 73
73 -
74
-
75
-
76
-
77
-
78
-
79
-
80
-
81
-
82
 |
 |

National Grid Gas plc Annual Report and Accounts 2010/11 61
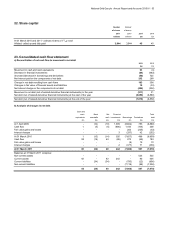
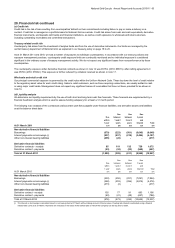
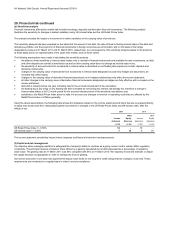
28. Financial risk continued
(a) Market risk continued
(ii) Cash flow and fair value interest rate risk
Interest rate risk arising from our financial investments is primarily variable being mainly composed of short-dated money funds.
2011 2010
£m £m
Fixed interest rate borrowings
Less than 1 year (83) (98)
In 1 - 2 years (24) (1)
In 2 - 3 years (501) (22)
In 3 - 4 years -(730)
In 4 - 5 years --
More than 5 years (2,658) (2,777)
(3,266) (3,628)
Floating interest rate borrowings (including RPI linked) (4,583) (4,044)
Non-interest bearing borrowings (53) -
Total borrowings (7,902) (7,672)
2011
Fixed Floating
rate rate RPI (i) Other (ii) Total
£m £m £m £m £m
Cash and cash equivalents 83 - - - 83
Financial investments - 242 - - 242
Borrowings (iii) (3,266) (958) (3,625) (53) (7,902)
Pre-derivative position (3,183) (716) (3,625) (53) (7,577)
Derivative effect 1,413 (1,135) 229 - 507
Net debt position (iv) (1,770) (1,851) (3,396) (53) (7,070)
2010
Fixed Floating
rate rate RPI(i) Other (ii) Total
£m £m £m £m £m
Cash and cash equivalents 1 - - - 1
Financial investments - 326 - - 326
Borrowings (iii) (3,628) (914) (3,130) - (7,672)
Pre-derivative position (3,627) (588) (3,130) - (7,345)
Derivative effect 756 (387) 117 - 486
(2,871) (975) (3,013) - (6,859)
(i) The post-derivative impact represents financial instruments linked to UK RPI.
(ii)
(iii) Includes bank overdrafts
(iv) The post derivative impact includes short-dated derivative contracts maturing within 12 months of the balance sheet date.
Represents financial instruments which are not directly affected by interest rate risk, including investments in equity or other non-interest bearing instruments.
During the years ended 31 March 2011 and 2010, net debt was managed using derivative instruments to hedge interest rate risk as follows:
Interest rate risk arises on our borrowings. Borrowings issued at variable rates expose us to cash flow interest rate risk. Borrowings issued at
fixed rates expose us to fair value interest rate risk. Our interest rate risk management policy as further explained on page 19 is to minimise
the finance costs (being interest costs and changes in the market value of debt) subject to certain constraints. Some of our borrowings issued
are index-linked, that is their cost is linked to changes in the UK Retail Prices Index (RPI). We believe that these borrowings provide a hedge
for revenues and regulatory asset values that are also RPI-linked.
The following table sets out the carrying amount, by contractual maturity, of borrowings that are exposed to interest rate risk before taking into
account interest rate swaps: