Marks and Spencer 2008 Annual Report Download - page 5
Download and view the complete annual report
Please find page 5 of the 2008 Marks and Spencer annual report below. You can navigate through the pages in the report by either clicking on the pages listed below, or by using the keyword search tool below to find specific information within the annual report.-
 1
1 -
 2
2 -
 3
3 -
 4
4 -
 5
5 -
 6
6 -
 7
7 -
 8
8 -
 9
9 -
 10
10 -
 11
11 -
 12
12 -
 13
13 -
 14
14 -
 15
15 -
 16
16 -
17
-
18
-
19
-
20
-
21
-
22
-
23
-
24
-
25
-
26
-
27
-
28
-
29
-
30
-
31
-
32
-
33
-
34
-
35
-
36
-
37
-
38
-
39
-
40
-
41
-
42
-
43
-
44
-
45
-
46
-
47
-
48
-
49
-
50
-
51
-
52
-
53
-
54
-
55
-
56
-
57
-
58
-
59
-
60
-
61
-
62
-
63
-
64
-
65
-
66
-
67
-
68
-
69
-
70
-
71
-
72
-
73
-
74
-
75
-
76
-
77
-
78
-
79
-
80
-
81
-
82
-
83
-
84
-
85
-
86
-
87
-
88
-
89
-
90
-
91
-
92
-
93
-
94
-
95
-
96
-
97
-
98
-
99
-
100
-
101
-
102
-
103
-
104
 |
 |

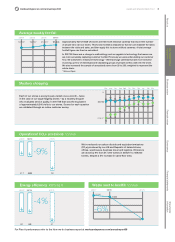
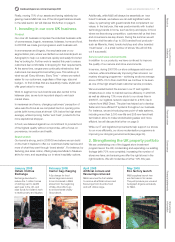
Average weekly footfall
Mystery shopping
May June July Aug Sept Oct Nov Dec Jan Feb Mar
84 85 84 85 85 86 87 88 87 88 87
70
73 73
78 79
81 82
84
82 82 83
Operational CO2e emissions tonnes
Energy efficiency kWh/sq ft Waste sent to landfill tonnes
2006/07 2007/08
469 Nil517
-9%
2006/07 2007/08
516568
-4%
-6%
2006/07 2007/08 2011/12
54,000
51,000
0
2011/12
2011/12
19.3m*
2004/05
19.8m*
2005/06
21.0m*
2006/07 2007/08
21.4m
2007/08
%
2006/07
marksandspencer.com/annualreport08 MARKS AND SPENCER GROUP PLC 3
Each of our stores is anonymously visited once a month – twice
in the case of our larger flagship stores – by a mystery shopper
who evaluates service quality. In 2007/08 that was the equivalent
of approximately 6,240 visits to our stores. Scores for each question
are validated through an online customer survey.
We’ve reduced our carbon dioxide and equivalent emissions
(CO2e) produced by our UK and Republic of Ireland stores,
offices, warehouses, business travel and logistics. Emissions
are down by 9% from 517,000 tonnes in 2006/07 to 469,000
tonnes, despite a 5% increase in sales-floor area.
Approximately half of M&S UK stores are fitted with entrance cameras that record the number
of people who visit our stores. This known footfall is analysed so that we can establish the ratios
between the visits and sales, and then apply this to stores without cameras. A total average
footfall figure can then be calculated.
In 2007/08 there was a change in methodology and an upgrade in technology that means we
are more accurately capturing customer footfall. Previously we were under-stating our customer
flow. We switched to enhanced technology – thermal image cameras that are more sensitive
in picking up flow of individuals and separating groups of people as they walk into the store.
We also increased the sample of annualised stores from 33 to 260, weighted to represent the
whole chain.
* Rebased figure
For Plan A performance refer to the How we do business report at marksandspencer.com/annualreport08
About us
Key performance
indicators Business review Financial review Governance Financial statements
Shareholder
information