Marks and Spencer 2008 Annual Report Download - page 4
Download and view the complete annual report
Please find page 4 of the 2008 Marks and Spencer annual report below. You can navigate through the pages in the report by either clicking on the pages listed below, or by using the keyword search tool below to find specific information within the annual report.-
 1
1 -
 2
2 -
 3
3 -
 4
4 -
 5
5 -
 6
6 -
 7
7 -
 8
8 -
 9
9 -
 10
10 -
 11
11 -
 12
12 -
 13
13 -
 14
14 -
 15
15 -
16
-
17
-
18
-
19
-
20
-
21
-
22
-
23
-
24
-
25
-
26
-
27
-
28
-
29
-
30
-
31
-
32
-
33
-
34
-
35
-
36
-
37
-
38
-
39
-
40
-
41
-
42
-
43
-
44
-
45
-
46
-
47
-
48
-
49
-
50
-
51
-
52
-
53
-
54
-
55
-
56
-
57
-
58
-
59
-
60
-
61
-
62
-
63
-
64
-
65
-
66
-
67
-
68
-
69
-
70
-
71
-
72
-
73
-
74
-
75
-
76
-
77
-
78
-
79
-
80
-
81
-
82
-
83
-
84
-
85
-
86
-
87
-
88
-
89
-
90
-
91
-
92
-
93
-
94
-
95
-
96
-
97
-
98
-
99
-
100
-
101
-
102
-
103
-
104
 |
 |

Market share value Clothing & footwear
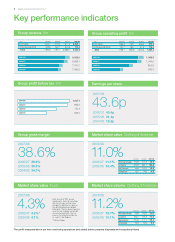
Group revenue £m
Group profit before tax £m
Group operating profit £m
Earnings per share
Group gross margin
Market share value Food Market share volume Clothing & footwear
43.6p
2006/07 40.4p
2005/06 31.4p
2004/05 19.2p
2007/08
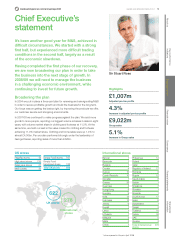
9,022.0
2007/08
8,588.1
2006/07
7,797.7
2005/06
7,490.5
2004/05
1,007.1
2007/08
965.2
2006/07
751.4
2005/06
556.1
2004/05
1,089.3
2007/08
1,044.0
2006/07
855.8
2005/06
649.1
2004/05
2MARKS AND SPENCER GROUP PLC
Key performance indicators
£m 2004/05 2005/06 2006/07 2007/08
■UK Retail 7,034.7 7,275.0 7,977.5 8,309.1
■International Retail 455.8 522.7 610.6 712.9
Total 7,490.5 7,797.7 8,588.1 9,022.0
£m 2004/05 2005/06 2006/07 2007/08
■UK Retail 588.4 790.1 956.5 972.9
■International Retail 60.7 65.7 87.5 116.4
Total 649.1 855.8 1,044.0 1,089.3
The profit measures above are from continuing operations and stated before property disposals and exceptional items.
2007/08
11. 0%
2006/07 11.1%
2005/06 10.4%
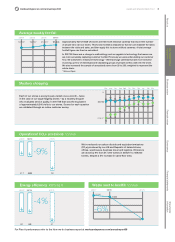
2005/06 2006/07 2007/08
Womenswear 10.5 11.3 11.1
Lingerie 24.3 26.1 24.8
Menswear 9.6 10.3 10.5
Kidswear 4.2 4.5 4.8
2007/08
4.3%
2006/07 4.2%*
2005/06 4.1%
Note: As part of TNS’ annual
restatements, data can sometimes
alter in prior years as they make
changes to definitions or clean up
the data following more detailed
information. This has always been the
case and any changes are typically
very small adjustments. This is a
process that all data providers do
as a part of due diligence.
* Rebased figure
2007/08
11. 2%
2006/07 10.7%
2005/06 10.1%
2005/06 2006/07 2007/08
Womenswear 8.8 10.0 10.0
Lingerie 16.7 18.3 17.9
Menswear 11.2 11.1 13.1
Kidswear 4.4 5.0 5.2
38.6%
2007/08
2006/07 38.9%
2005/06 38.3%
2004/05 34.7%