Marks and Spencer 2004 Annual Report Download - page 5
Download and view the complete annual report
Please find page 5 of the 2004 Marks and Spencer annual report below. You can navigate through the pages in the report by either clicking on the pages listed below, or by using the keyword search tool below to find specific information within the annual report.-
 1
1 -
 2
2 -
 3
3 -
 4
4 -
 5
5 -
 6
6 -
 7
7 -
 8
8 -
 9
9 -
 10
10 -
 11
11 -
 12
12 -
 13
13 -
 14
14 -
 15
15 -
 16
16 -
17
-
18
-
19
-
20
-
21
-
22
-
23
-
24
-
25
-
26
-
27
-
28
-
29
-
30
-
31
-
32
-
33
-
34
-
35
-
36
-
37
-
38
-
39
-
40
-
41
-
42
-
43
-
44
-
45
-
46
-
47
-
48
-
49
-
50
-
51
-
52
-
53
-
54
-
55
-
56
-
57
-
58
-
59
-
60
 |
 |

3
www.marksandspencer.com
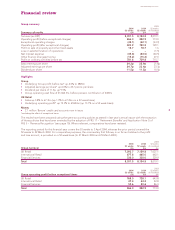
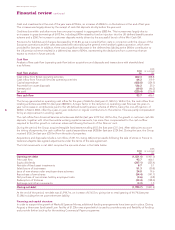
Financial review
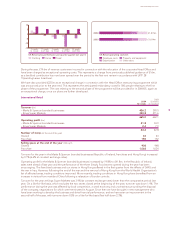
Group summary 2003
2004 2004 52 weeks
53 weeks 52 weeks As restated
Summary of results £m £m £m
Turnover (ex VAT) 8,301.5 8,154.8 8,019.1
Operating profit (before exceptional charges) 866.0 822.9 773.0
Exceptional operating charges (42.1) (42.1) (43.9)
Operating profit (after exceptional charges) 823.9 780.8 729.1
Profit on sale of property and other fixed assets 18.7 18.7 1.6
Loss on sale/termination of operations ––(1.5)
Net interest expense (45.8) (44.5) (40.5)
Other finance (charges)/income (15.2) (15.2) 27.0
Profit on ordinary activities before tax 781.6 739.8 715.7
Basic earnings per share 24.2p 22.9p 21.8p
Adjusted earnings per share 24.7p 23.4p 23.3p
Dividend per share 11.5p 11.5p 10.5p
Highlights
Group
•Underlying Group profit before tax* up 6.0% to £805m
•Adjusted earnings per share* up 6.0% to 24.7 pence per share
•Dividend per share of 11.5p, up 9.5%
•Group operating cash flow of £1,066.5m, before pension contribution of £400m
UK Retail
•Sales up 3.8% to £7.3bn (up 1.9% to £7.2bn on a 52 week basis)
•Underlying operating profit* up 19.3% to £768.0m (up 13.1% on a 52 week basis)
Money
•2.1 million ‘&more’ credit card accounts now in issue
*excluding the effect of exceptional items
The results have been prepared using the same accounting policies as stated in last year’s annual report with the exception
of those policies that have been amended by the adoption of FRS 17 – ‘Retirement Benefits’ and Application Note G of
FRS 5 – ‘Revenue Recognition’ (see page 10). Where relevant, comparatives have been restated.
The reporting period for this financial year covers the 53 weeks to 3 April 2004, whereas the prior period covered the
52 weeks to 29 March 2003. For comparative purposes, the commentary that follows, in so far as it relates to the profit
and loss account, is provided on a 52 week basis (to 27 March 2004 and 29 March 2003).
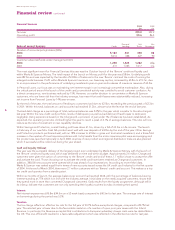
2003
2004 2004 52 weeks
53 weeks 52 weeks As restated
Group turnover £m £m £m
UK Retail 7,293.7 7,159.8 7,027.1
International Retail 677.8 665.0 662.1
Financial Services 330.0 330.0 329.9
Total 8,301.5 8,154.8 8,019.1
2003
2004 2004 52 weeks
53 weeks 52 weeks As restated
Group operating profit before exceptional items £m £m £m
UK Retail 768.0 728.1 643.8
International Retail 47.4 44.2 42.8
Financial Services 50.6 50.6 86.4
Total 866.0 822.9 773.0