Marks and Spencer 2004 Annual Report Download - page 10
Download and view the complete annual report
Please find page 10 of the 2004 Marks and Spencer annual report below. You can navigate through the pages in the report by either clicking on the pages listed below, or by using the keyword search tool below to find specific information within the annual report.-
 1
1 -
 2
2 -
 3
3 -
 4
4 -
 5
5 -
 6
6 -
 7
7 -
 8
8 -
 9
9 -
 10
10 -
 11
11 -
 12
12 -
 13
13 -
 14
14 -
 15
15 -
 16
16 -
 17
17 -
 18
18 -
 19
19 -
 20
20 -
 21
21 -
22
-
23
-
24
-
25
-
26
-
27
-
28
-
29
-
30
-
31
-
32
-
33
-
34
-
35
-
36
-
37
-
38
-
39
-
40
-
41
-
42
-
43
-
44
-
45
-
46
-
47
-
48
-
49
-
50
-
51
-
52
-
53
-
54
-
55
-
56
-
57
-
58
-
59
-
60
 |
 |

8
Marks and Spencer Group plc
Financial review continued
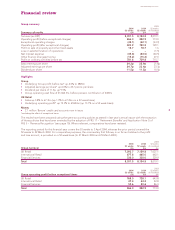
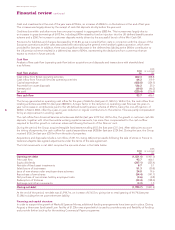
Cash and investments at the end of the year were £720.6m, an increase of £248.7m on the balance at the end of last year.
This increase was largely driven by the receipt of cash ISA deposits shortly before the year end.
Creditors due within and after more than one year increased in aggregate by £883.4m. This increase was largely due to
an increase in gross borrowings of £413.9m, including £400m raised to fund an injection into the UK defined benefit pension
scheme and a £360.7m increase in customer deposits mainly driven by the successful launch of the Mini Cash ISA.
Provisions for liabilities and charges decreased by £136.8m as we incurred further costs in connection with the closure of the
European operations and the costs associated with rationalising the general merchandise logistics operation, which were
provided for last year. In addition, there was a significant decrease in the deferred tax liability as the £400m contribution to
the UK pension scheme resulted in a deferred tax asset of £90m, representing the deductions from current tax that we
expect to receive in future periods.
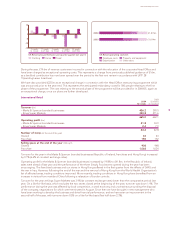
Cash flow
Analysis of free cash flow (operating cash flow before acquisitions and disposals and transactions with shareholders)
is as follows:
2003
2004 As restated
Cash flow analysis £m £m
Cash inflow from Retail operating activities 602.3 848.8
Cash inflow from Financial Services operating activities 64.2 319.9
Capital expenditure (428.8) (324.5)
Proceeds from asset disposals 126.2 25.0
Interest paid (49.8) (46.2)
Tax paid (220.4) (216.9)
Free cash flow 93.7 606.1
The Group generated an operating cash inflow for the year of £666.5m (last year £1,168.7m). Within this, the cash inflow from
retailing activities was £602.3m (last year £848.8m). A major factor in the reduction in operating cash flow was the year-on-
year net increase in contributions paid to the UK defined benefit pension scheme of £357m, being the one-off injection of
£400m in March 2004, offset by a year-on-year reduction in regular contributions to the scheme. This was partly compensated
for by an improvement in working capital.
The cash inflow from Financial Services activities was £64.2m (last year £319.9m). Within this, the growth in customer cash ISA
deposits, together with other favourable working capital movements, has more than compensated for the cash outflow
required to fund the growth in customer advances following the launch of the ‘&more’ card.
During the period, the Group acquired tangible fixed assets totalling £433.5m (last year £311.0m). After taking into account
the timing of payments, the cash outflow for capital expenditure was £428.8m (last year £324.5m). During the year, the Group
received £126.2m (last year £25.0m) from the sale of properties.
Acquisitions and disposals include a net inflow of £51.3m, being deferred proceeds following the sale of stores in France to
Galeries Lafayette less agreed adjustments under the terms of the sale agreement.
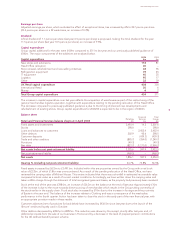
The total movements in net debt comprise the amounts shown in the table below:
2003
2004 As restated
£m £m
Opening net debt (1,831.4) (1,907.0)
Free cash flow 93.7 606.1
Equity dividends (247.1) (225.4)
Net sale of fixed asset investments 8.7 5.1
Sale/closure of businesses 51.3 (30.8)
Issue of new shares under employee share schemes 24.8 19.6
Repurchase of own shares (54.4) (141.7)
Net purchase of own shares held by employee trusts (3.6) (0.8)
Redemption of B shares (33.4) (158.0)
Exchange and other movements (3.3) 1.5
Closing net debt (1,994.7) (1,831.4)
At the end of the period, net debt was £1,994.7m, an increase of £163.3m, giving rise to retail gearing of 44.7% (last year
53.0%) including the net post-retirement liability.
Financing and capital structure
In order to support the growth of Marks & Spencer Money, additional funding arrangements have been put in place. During
August, a three-year Syndicated Loan Facility of £1.25bn was signed which is used to provide surety and flexibility of funding
and provide further back-up for the existing Commercial Paper programme.