Marks and Spencer 2000 Annual Report Download - page 5
Download and view the complete annual report
Please find page 5 of the 2000 Marks and Spencer annual report below. You can navigate through the pages in the report by either clicking on the pages listed below, or by using the keyword search tool below to find specific information within the annual report.-
 1
1 -
 2
2 -
 3
3 -
 4
4 -
 5
5 -
 6
6 -
 7
7 -
 8
8 -
 9
9 -
 10
10 -
 11
11 -
 12
12 -
 13
13 -
 14
14 -
 15
15 -
 16
16 -
17
-
18
-
19
-
20
-
21
-
22
-
23
-
24
-
25
-
26
-
27
-
28
-
29
-
30
-
31
-
32
-
33
-
34
-
35
-
36
-
37
-
38
-
39
-
40
-
41
-
42
-
43
-
44
-
45
-
46
-
47
-
48
 |
 |

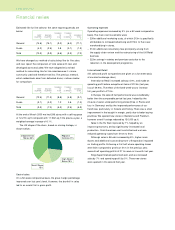
Financial Services
This Operating Division includes five profit centres:
Store Cards
Personal Lending
Unit Trusts
Life Assurance
MS Insurance (Guernsey)
The overall results are given in the segmental analysis (see note
2, page 25).
The first four of the five profit centres are managed as a
single operation (the results for the Life Assurance company
being aggregated on an Embedded Value basis). MS Insurance
derives the majority of its underwriting business from the other
Financial Services activities.
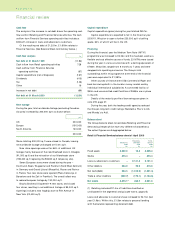
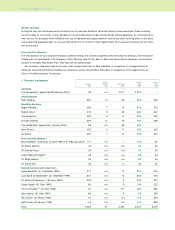
The scale of current business levels is indicated below:
ACCOUNT PERSONAL UNIT LIFE
CARDS LENDING TRUSTS ASSURANCE
Number of accounts/
policy holders (000s)
2000 5,101 567 186 58
1999 5,166 548 171 30
Customer outstandings/funds
under management (£m)
2000 646 1,495 1,166 n/a
1999 652 1,283 1,101 n/a
The credit activities are carried out within Marks and Spencer
Financial Services Limited, a bank regulated by the FSA. The
Unit Trust, Life Assurance and Corporate PEP/ISA businesses are
carried out by companies regulated by IMRO, PIA and the FSA.
Exceptional items (£139.7m)
(a) UK Restructuring (£63.3m) – of this total, £16.0m of
redundancy costs were reported at the half year in respect
of the rationalisation of UK store management and the
closure of a distribution centre. The additional £47.3m
includes:
– Head Office costs of £18.5m mainly resulting from the
restructuring of UK Retail into seven Customer Business
Units
– £28.8m which reflects reductions in store management
supervision numbers.
(b) European Restructuring (£17.0m) – the loss on sale of
property of £8.3m relates to the European store closures
announced during the period. After including the redundancy
and related costs of £8.7m the total was £17.0m.
(c) Canada (£45.4m) – the closure of our Canadian business
was completed at a cost of £21m compared to an estimate
of £25m. Goodwill previously written off to reserves of
£24.4m increased the exceptional charge.
(d) The net loss on other property disposals was £14.0m
(excluding European store closures referred to in (b) above),
of which a £17.2m loss relates to the disposal of The Gyle
Shopping Centre (see note 4C, page 27). As an investment
property, the Gyle had been revalued annually since its
acquisition in January 1997 and the cumulative revaluation
had been recognised through the Statement of Total
Recognised Gains and Losses in previous years. As a
consequence, the Group has realised a profit of £53.4m
based on net sale proceeds less the original purchase price
which has not been reflected in the profit and loss account.
Interest
Net interest income fell to £14.2m from £27.9m last year.
This was caused by lower average sterling cash balances
(including interest-bearing investments) of £422m (last year
£820m), offset by an increase in sterling interest rates.
Interest payments on intra group and external borrowings
for the Financial Services business are charged to that business
as cost of sales. The operating profit for Financial Services is
shown in the segmental analysis (see note 2, page 25). The total
interest cost incurred by Financial Services was £105.5m (last
year £102.3m).
Taxation
The Group tax charge for the year is £158.2m, giving an
effective rate of 38% after exceptional charges. This is an
increase on the previous year’s rate of 32%. The increase
results from certain exceptional charges and unrelieved
losses arising overseas.
Earnings per share
An adjusted earnings per share figure of 13.2p (last year 15.6p)
has been calculated to give a clearer understanding of the
trading performance of the Group. It excludes the effect of the
exceptional items noted above. Details of the calculation are
given in note 9, page 29.
Dividend
The reduction of the dividend payout to 9.0p was a difficult
decision for the Company, but our confidence in the future is
reflected by the fact that shareholders will receive a payment
equivalent to the full net profits for the year just ended. This will
re-base the dividend to a level from which appropriate earnings
cover can be re-established more quickly, improving our ability
to invest in the Group’s future growth.
3Annual Report and Financial Statements 2000