Marks and Spencer 2000 Annual Report Download - page 4
Download and view the complete annual report
Please find page 4 of the 2000 Marks and Spencer annual report below. You can navigate through the pages in the report by either clicking on the pages listed below, or by using the keyword search tool below to find specific information within the annual report.-
 1
1 -
 2
2 -
 3
3 -
 4
4 -
 5
5 -
 6
6 -
 7
7 -
 8
8 -
 9
9 -
 10
10 -
 11
11 -
 12
12 -
 13
13 -
 14
14 -
 15
15 -
16
-
17
-
18
-
19
-
20
-
21
-
22
-
23
-
24
-
25
-
26
-
27
-
28
-
29
-
30
-
31
-
32
-
33
-
34
-
35
-
36
-
37
-
38
-
39
-
40
-
41
-
42
-
43
-
44
-
45
-
46
-
47
-
48
 |
 |

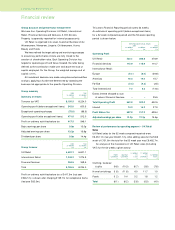
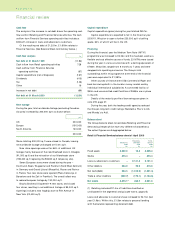
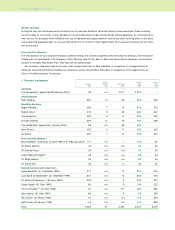
Estimated like for like sales for the same reporting periods are
below: 15 WEEKS 11 WEEKS
FIRST SECOND TO TO 52 WEEKS
QUARTER QUARTER 8 JAN 25 MARCH TOTAL
%%%%%
General (14.6) (15.1) (9.2) (6.0) (11.1)
Foods (4.2) (2.5) 0.8 (0.1) (1.3)
Total (10.3) (9.9) (5.6) (3.3) (7.2)
We have changed our method of calculating like for like sales
and now report the comparison of total sales with new and
developed stores excluded. We have adopted this revised
method for calculating like for like sales because it is more
commonly used and therefore familiar. The previous method,
which added back sales from deflected stores, is shown below
for comparison:
15 WEEKS 11 WEEKS
FIRST SECOND TO TO 52 WEEKS
QUARTER QUARTER 8 JAN 25 MARCH TOTAL
%%%%%
General (12.5) (11.3) (8.8) (4.8) (9.1)
Foods (3.1) (0.2) 1.2 0.6 (1.0)
Total (9.3) (7.0) (5.3) (2.5) (5.9)
At the end of March 2000 we had 296 stores with a selling space
of 12.27m sq ft compared with 11.96m sq ft the previous year, a
weighted average increase of 6.1%.
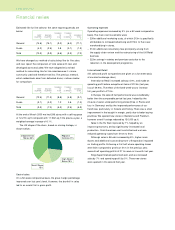
The UK shape of the chain, based on closing footage, is
shown below:
Cost of sales
On a 52 week comparative basis, the gross margin percentage
improved over last year’s level. However, the shortfall in sales
led to an overall fall in gross profit.
Operating expenses
Operating expenses increased by 3% (on a 52 week comparative
basis). The main cost movements were:
– £39m additional marketing costs, of which £13m is specifically
attributable to increased advertising and £14m to the visual
merchandising in stores.
– £13m additional consultancy fees principally arising from
the supply chain review and the restructuring of the UK Retail
business.
– £23m savings in estates and premises costs due to the
reduction in the development programme.
International Retail
(All sales and profit comparatives are given on a 52 week basis
at constant exchange rates.)
International Retail increased sales by 5.9%, and made an
operating profit before exceptional items of £0.3m (last year,
loss of £9.9m). The effect of the 53rd week was to increase
full year profits to £7.0m.
In Europe, the second half performance was considerably
better than the comparable period last year, helped by the
closure of seven under-performing stores (three in France and
four in Germany) and by the improved performance of our
franchises, particularly in Greece and Turkey. There was a small
improvement in the bought in margin, partly due to better buying
practices. We opened new stores in Barcelona and Frankfurt,
however overall footage reduced by 130,000 sq ft.
Sales in the Far East improved by 7% helped by an
improving economy and by significantly increased local
production. Costs have been well controlled and we have
reduced operating losses from £14m to £4m.
Although sales in Brooks increased by 8%, higher mark-
downs and additional costs arising from USexpansion impacted
on trading profits. Following a first half where operating losses
were £5m compared to profits of £1m in the previous year,
second half operating profits of £11m were in line with last year.
Kings Super Markets performed well, and we increased
sales by 7% and operating profit by 5%. Three new stores
were opened in the second half-year.
2Marks and Spencer p.l.c.
Financial review
Departmental
Stores 39% Regional
Centres 27%
High Street
Stores 19%
Small Stores
15%