Marks and Spencer 2000 Annual Report Download - page 3
Download and view the complete annual report
Please find page 3 of the 2000 Marks and Spencer annual report below. You can navigate through the pages in the report by either clicking on the pages listed below, or by using the keyword search tool below to find specific information within the annual report.-
 1
1 -
 2
2 -
 3
3 -
 4
4 -
 5
5 -
 6
6 -
 7
7 -
 8
8 -
 9
9 -
 10
10 -
 11
11 -
 12
12 -
 13
13 -
 14
14 -
15
-
16
-
17
-
18
-
19
-
20
-
21
-
22
-
23
-
24
-
25
-
26
-
27
-
28
-
29
-
30
-
31
-
32
-
33
-
34
-
35
-
36
-
37
-
38
-
39
-
40
-
41
-
42
-
43
-
44
-
45
-
46
-
47
-
48
 |
 |

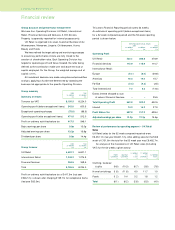
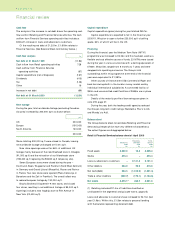
Financial review
Group structure and performance measurement
We have four Operating Divisions: UK Retail, International
Retail, Financial Services and Ventures. A fifth division,
Property, is separately reported for internal purposes only.
UK Retail is organised into seven Customer Business Units:
Womenswear, Menswear, Lingerie, Childrenswear, Home,
Beauty and Foods.
We have refined the target setting and monitoring processes
to ensure key performance criteria are fully linked to the
creation of shareholder value. Each Operating Division has
targets for operating profit and Value Created, the latter being
defined as the contribution made over and above the cost of
capital employed. For the Group, the weighted average cost of
capital is 10%.
All investment decisions are made using discounted cashflow
analysis, applying a hurdle rate determined by assessing the
business risk appropriate to the specific Operating Division.
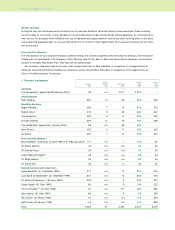
Group summary 2000 1999
53 WEEKS 52 WEEKS
Summary of results £m £m
Turnover (ex VAT) 8,195.5 8,224.0
Operating profit (before exceptional items) 543.0 600.5
Exceptional operating charges (72.0) (88.5)
Operating profit (after exceptional items) 471.0 512.0
Profit on ordinary activities before tax 417.5 546.1
Basic earnings per share 9.0p 13.0p
Adjusted earnings per share 13.2p 15.6p
Dividend per share 9.0p 14.4p
2000 1999
53 WEEKS 52 WEEKS
Group turnover £m £m
UK Retail 6,482.7 6,601.1
International Retail 1,348.2 1,274.3
Financial Services 364.6 348.6
Total 8,195.5 8,224.0
Profit on ordinary activities before tax of £417.5m (last year
£546.1m) is shown after charging £139.7m for exceptional items
(last year £82.3m).
This year’s Financial Reporting period covers 53 weeks.
An estimate of operating profit (before exceptional items)
for a 52 week comparative period and the 53 week reporting
period is shown below.
BEFORE EXCEPTIONAL ITEMS
2000 1999
53 WEEKS 52 WEEKS 52 WEEKS
£m £m £m
Operating Profit
UK Retail 420.1 386.8 478.9
Financial Services 115.9 115.9 110.7
International Retail:
Europe (6.1) (9.4) (26.8)
Americas 16.4 14.0 15.7
Far East (3.3) (4.3) (3.5)
Total International 7.0 0.3 (14.6)
Excess interest charged to cost
of sales of Financial Services ––25.5
Total O perating Profit 543.0 503.0 600.5
Interest 14.2 14.2 27.9
Profit Before Tax 557.2 517.2 628.4
Adjusted earnings per share 13.2p 12.2p 15.6p
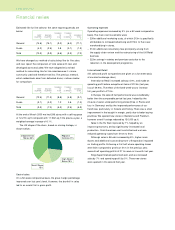
Review of performance by operating segment – UK Retail
Sales
UK Retail sales for the 52 week comparative period were
£6,351.1m (last year £6,601.1m). After adding sales for the 53rd
week of £131.6m the total for the 53 week year was £6,482.7m.
An analysis of the movements in UK Retail sales (including
VAT) for the 52 weeks is given below:
15 WEEKS 11 WEEKS
FIRST SECOND TO TO 52 WEEKS
QUARTER QUARTER 8 JAN 25 MARCH TOTAL
%%%%%
Clothing, footwear
& gifts (9.8) (10.3) (6.7) (3.6) (7.8)
Home furnishings (1.6) (11.6) 6.0 11.7 1.0
Foods (1.2) 0.4 3.2 1.8 1.2
Total (6.1) (6.2) (2.8) (0.5) (4.0)
1Annual Report and Financial Statements 2000