Louis Vuitton 2003 Annual Report Download - page 8
Download and view the complete annual report
Please find page 8 of the 2003 Louis Vuitton annual report below. You can navigate through the pages in the report by either clicking on the pages listed below, or by using the keyword search tool below to find specific information within the annual report.-
 1
1 -
 2
2 -
 3
3 -
 4
4 -
 5
5 -
 6
6 -
 7
7 -
 8
8 -
 9
9 -
 10
10 -
 11
11 -
 12
12 -
 13
13 -
 14
14 -
 15
15 -
 16
16 -
 17
17 -
 18
18 -
 19
19 -
20
-
21
-
22
-
23
-
24
-
25
-
26
-
27
-
28
-
29
-
30
-
31
-
32
-
33
-
34
-
35
-
36
-
37
-
38
-
39
-
40
-
41
-
42
-
43
-
44
-
45
-
46
-
47
-
48
-
49
-
50
-
51
-
52
-
53
-
54
-
55
-
56
-
57
-
58
-
59
-
60
-
61
-
62
-
63
-
64
-
65
-
66
-
67
-
68
-
69
-
70
-
71
-
72
-
73
-
74
-
75
-
76
-
77
-
78
-
79
-
80
-
81
-
82
-
83
-
84
-
85
-
86
-
87
-
88
-
89
-
90
-
91
-
92
-
93
-
94
-
95
-
96
-
97
-
98
-
99
-
100
-
101
-
102
-
103
-
104
-
105
-
106
-
107
-
108
 |
 |

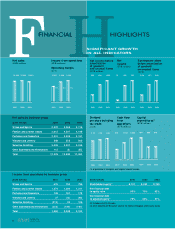
FINANCIAL HIGHLIGHTS
Net sales by business group
(EUR million) 2001 2002 2003
Wines and Spirits 2,232 2,266 2,116
Fashion and Leather Goods 3,612 4,207 4,149
Perfumes and Cosmetics 2,231 2,336 2,181
Watches and Jewelry 548 552 502
Selective Retailing 3,493 3,337 3,039
Other businesses and eliminations 113 (5) (25)
Total 12,229 12,693 11,962
Income from operations by business group
(EUR million) 2001 2002 2003
Wines and Spirits 676 750 796
Fashion and Leather Goods 1,274 1,280 1,311
Perfumes and Cosmetics 149 161 178
Watches and Jewelry 27 (13) (48)
Selective Retailing (213) 20 106
Other businesses and eliminations (353) (190) (161)
Total 1,560 2,008 2,182
(EUR million) 2001 2002 2003
Stockholders’equity(2) 8,701 8,842 8,769
Net financial debt
to equity ratio 95% 73% 62%
Net financial debt
to adjusted equity(3) 79% 66% 57%
(2) I ncludes minority interests.
(3) After deduction of the market value of the equity in Bouygues and treasury shares.
Net sales
(EUR million) Income from operations
(EUR millions)
Operating margin
(in %)
Dividend
per share including
tax credit
(EUR)
Cash flow
from
operations
(EUR million)
Capital
expenditures(1)
(EUR million)
2001 2002 2003
1.20 1.281.13
2001 2002 2003
1,518 1,949919
2001 2002 2003
559 578984
Net income before
amortization
of goodwill
and unusual items
(EUR million)
Net
income
(EUR million)
Earnings per share
before amortization
of goodwill
an unusual items
(EUR)
2001 2002 2003
556 72310
2001 2002 2003
1.67 2.090.68
(1) Acquisitions of intangible and tangible long-term assets.
6LVMH ANNUAL
REPORT 2003
F H
SIGNIFICANT GROWTH
IN ALL INDICATORS
2001 2002 2003
12,693 11,96212,229
2001 2002 2003
2,008 2,1821,560
16% 18%13%
2001 2002 2003
818 1,023334