Logitech 2001 Annual Report Download - page 27
Download and view the complete annual report
Please find page 27 of the 2001 Logitech annual report below. You can navigate through the pages in the report by either clicking on the pages listed below, or by using the keyword search tool below to find specific information within the annual report.-
 1
1 -
2
-
3
-
4
-
5
-
6
-
7
-
8
-
9
-
10
-
11
-
12
-
13
-
14
-
15
-
16
-
 17
17 -
 18
18 -
 19
19 -
 20
20 -
 21
21 -
 22
22 -
 23
23 -
 24
24 -
 25
25 -
 26
26 -
 27
27 -
 28
28 -
 29
29 -
 30
30 -
 31
31 -
 32
32 -
 33
33 -
 34
34 -
 35
35 -
 36
36 -
 37
37 -
38
-
39
-
40
-
41
-
42
-
43
-
44
-
45
-
46
-
47
 |
 |

NN
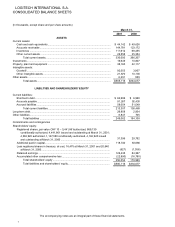
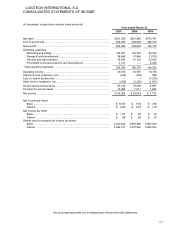
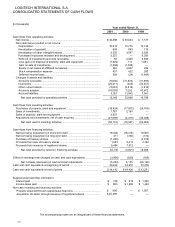
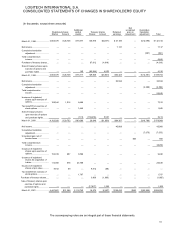
LOGITECH INTERNATIONAL S.A.
CONSOLIDATED STATEMENTS OF CASH FLOWS
(In thousands)
Year ended March 31,
2001 2000 1999
Cash flows from o
p
eratin
g
activities:
Net income................................................................................................... $ 45,068 $ 30,044 $ 7,137
Non-cash items included in net income:
De
p
reciation ............................................................................................. 19,012 15,775 13,135
Amortization of
g
oodwill............................................................................ 693 693 115
Amortization of other intan
g
ible assets..................................................... 2,335 3,547 2,528
Purchased in-
p
rocess research and develo
p
ment.................................... 3,275 — 6,200
Write-off of investments and note receivable............................................ 50 2,000 5,800
Loss
(g
ain
)
on dis
p
osal of
p
ro
p
ert
y
,
p
lant and e
q
ui
p
ment........................
(
1,922
)
117 1,081
Gain on sale of investments.....................................................................
(
1,296
)
(
1,525
)
—
E
q
uit
y
in net losses of affiliated com
p
anies ............................................. 440 4,627 254
Stock com
p
ensation ex
p
ense .................................................................. 437 422 283
Deferred income taxes............................................................................. 593
(
24
)
(
1,844
)
Chan
g
es in assets and liabilities:
Accounts receivable .................................................................................
(
6,630
)
(
31,823
)
(
31,886
)
Inventories................................................................................................
(
29,411
)
(
345
)
(
32,301
)
Other current assets.................................................................................
(
5,643
)
(
9,816
)
(
1,916
)
Accounts
p
a
y
able .....................................................................................
(
18,009
)
7,232 40,672
Accrued liabilities...................................................................................... 3,051 11,942 7,541
Net cash provided by operating activities ............................................. 12,043 32,866 16,799
Cash flows from investin
g
activities:
Purchases of
p
ro
p
ert
y
,
p
lant and e
q
ui
p
ment ...............................................
(
16,824
)
(
17,872
)
(
24,756
)
Sales of investments.................................................................................... 1,767 2,150 —
Sales of
p
ro
p
ert
y
,
p
lant and e
q
ui
p
ment ....................................................... 3,637 — —
Acquisitions and investments, net of cash acquired..................................... (47,696) (4,219) (40,048)
Net cash used in investing activities ..................................................... (59,116) (19,941) (64,804)
Cash flows from financin
g
activities:
Net borrowin
g
(
re
p
a
y
ment
)
of short-term debt ............................................. 35,000
(
18,416
)
19,063
Net borrowin
g
(
re
p
a
y
ment
)
of lon
g
-term debt .............................................. 211
(
330
)
(
172
)
Purchase of treasur
y
shares ........................................................................
(
1,065
)
—
(
4,018
)
Proceeds from sale of treasur
y
shares ........................................................ 1,553 5,413 4,192
Proceeds from issuance of registered shares.............................................. 9,496 7,512 —
Net cash provided by (used in) financing activities ............................... 45,195 (5,821) 19,065
Effect of exchange rate changes on cash and cash equivalents ..................... (3,406) (929) (185)
Net increase
(
decrease
)
in cash and cash e
q
uivalents.........................
(
5,284
)
6,175
(
29,125
)
Cash and cash equivalents at beginning of period........................................... 49,426 43,251 72,376
Cash and cash equivalents at end of period .................................................... $ 44,142 $ 49,426 $ 43,251
Su
pp
lemental cash flow information:
Interest
p
aid ................................................................................................. $ 158 $ 616 $ 1,230
Income taxes
p
aid........................................................................................ $ 863 $ 1,808 $ 1,423
Non-cash investin
g
and financin
g
activities:
Pro
p
ert
y
ac
q
uired throu
g
h ca
p
ital lease financin
g
...................................... $ 900 — $ 1
,
007
Ac
q
uisition of Labtec throu
g
h issuance of re
g
istered shares ...................... $ 25
,
436 — —
The accompanying notes are an integral part of these financial statements.