LinkedIn 2013 Annual Report Download - page 96
Download and view the complete annual report
Please find page 96 of the 2013 LinkedIn annual report below. You can navigate through the pages in the report by either clicking on the pages listed below, or by using the keyword search tool below to find specific information within the annual report.-
 1
1 -
2
-
3
-
4
-
5
-
6
-
7
-
8
-
9
-
10
-
11
-
12
-
13
-
14
-
15
-
16
-
17
-
18
-
19
-
20
-
21
-
22
-
23
-
24
-
25
-
26
-
27
-
28
-
29
-
30
-
31
-
32
-
33
-
34
-
35
-
36
-
37
-
38
-
39
-
40
-
41
-
42
-
43
-
44
-
45
-
46
-
47
-
48
-
49
-
50
-
51
-
52
-
53
-
54
-
55
-
56
-
57
-
58
-
59
-
60
-
61
-
62
-
63
-
64
-
65
-
66
-
67
-
68
-
69
-
70
-
71
-
72
-
73
-
74
-
75
-
76
-
77
-
78
-
79
-
80
-
81
-
82
-
83
-
84
-
85
-
 86
86 -
 87
87 -
 88
88 -
 89
89 -
 90
90 -
 91
91 -
 92
92 -
 93
93 -
 94
94 -
 95
95 -
 96
96 -
 97
97 -
 98
98 -
 99
99 -
 100
100 -
 101
101 -
 102
102 -
 103
103 -
 104
104 -
 105
105 -
 106
106 -
107
-
108
-
109
-
110
-
111
-
112
-
113
-
114
-
115
-
116
 |
 |

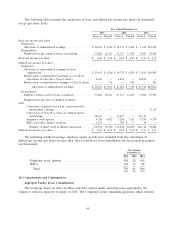
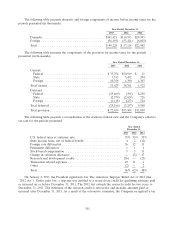
The following table presents the calculation of basic and diluted net income per share (in thousands,
except per share data):
Year Ended December 31,
2013 2012 2011
Class A Class B Class A Class B Class A Class B
Basic net income per share:
Numerator:
Allocation of undistributed earnings .............. $22,443 $ 4,326 $ 14,735 $ 6,874 $ 1,420 $10,492
Denominator:
Weighted-average common shares outstanding ....... 95,282 18,361 71,711 33,455 9,200 67,985
Basic net income per share ....................... $ 0.24 $ 0.24 $ 0.21 $ 0.21 $ 0.15 $ 0.15
Diluted net income per share:
Numerator:
Allocation of undistributed earnings for basic
computation ............................. $22,443 $ 4,326 $ 14,735 $ 6,874 $ 1,420 $10,492
Reallocation of undistributed earnings as a result of
conversion of Class B to Class A shares .......... 4,326 — 6,874 — 10,492 —
Reallocation of undistributed earnings to Class B shares — 713 — 902 — 364
Allocation of undistributed earnings .......... $ 26,769 $ 5,039 $ 21,609 $ 7,776 $ 11,912 $10,856
Denominator:
Number of shares used in basic calculation .......... 95,282 18,361 71,711 33,455 9,200 67,985
Weighted-average effect of dilutive securities
Add:
Conversion of preferred stock in connection with
initial public offering ..................... — — — — — 17,133
Conversion of Class B to Class A common shares
outstanding ............................ 18,361 — 33,455 — 85,118 —
Employee stock options ..................... 4,128 4,025 7,288 7,151 9,770 9,770
RSUs and other dilutive securities .............. 1,173 — 390 $ — 30 —
Number of shares used in diluted calculation ..... 118,944 22,386 112,844 40,606 104,118 94,888
Diluted net income per share ...................... $ 0.23 $ 0.23 $ 0.19 $ 0.19 $ 0.11 $ 0.11
The following weighted-average employee equity awards were excluded from the calculation of
diluted net income per share because their effect would have been anti-dilutive for the periods presented
(in thousands):
Year Ended
December 31,
2013 2012 2011
Employee stock options ................................. 588 28 418
RSUs .............................................. 162 36 88
Total ............................................. 750 64 506
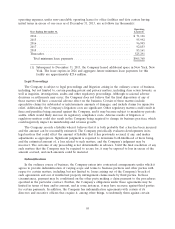
10. Commitments and Contingencies
Aggregate Future Lease Commitments
The Company leases its office facilities and data centers under operating lease agreements, the
longest of which is expected to expire in 2026. The Company’s future minimum payments, which exclude
94