LinkedIn 2013 Annual Report Download - page 106
Download and view the complete annual report
Please find page 106 of the 2013 LinkedIn annual report below. You can navigate through the pages in the report by either clicking on the pages listed below, or by using the keyword search tool below to find specific information within the annual report.-
 1
1 -
2
-
3
-
4
-
5
-
6
-
7
-
8
-
9
-
10
-
11
-
12
-
13
-
14
-
15
-
16
-
17
-
18
-
19
-
20
-
21
-
22
-
23
-
24
-
25
-
26
-
27
-
28
-
29
-
30
-
31
-
32
-
33
-
34
-
35
-
36
-
37
-
38
-
39
-
40
-
41
-
42
-
43
-
44
-
45
-
46
-
47
-
48
-
49
-
50
-
51
-
52
-
53
-
54
-
55
-
56
-
57
-
58
-
59
-
60
-
61
-
62
-
63
-
64
-
65
-
66
-
67
-
68
-
69
-
70
-
71
-
72
-
73
-
74
-
75
-
76
-
77
-
78
-
79
-
80
-
81
-
82
-
83
-
84
-
85
-
86
-
87
-
88
-
89
-
90
-
91
-
92
-
93
-
94
-
95
-
 96
96 -
 97
97 -
 98
98 -
 99
99 -
 100
100 -
 101
101 -
 102
102 -
 103
103 -
 104
104 -
 105
105 -
 106
106 -
 107
107 -
 108
108 -
 109
109 -
 110
110 -
 111
111 -
 112
112 -
 113
113 -
 114
114 -
 115
115 -
 116
116
 |
 |

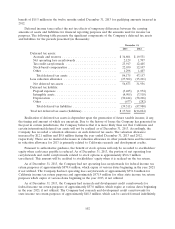
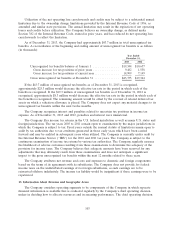
maker for the Company is the Chief Executive Officer. The Chief Executive Officer reviews financial
information presented on a consolidated basis, accompanied by information about revenue by product
line, sales channel, and geographic region for purposes of allocating resources and evaluating financial
performance. Accordingly, the Company has determined that it has one operating segment, and therefore,
one reportable segment.
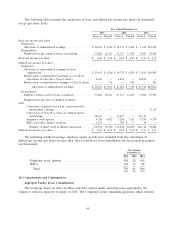
Revenue by geography is generally based on the shipping address of the customer. The following
tables present the Company’s revenue by product line, as well as revenue and long-lived assets by
geographic region for the periods presented (in thousands):
Year Ended December 31,
2013 2012 2011
Net revenue by product:
Talent Solutions ......................... $ 859,674 $523,582 $260,885
Marketing Solutions ...................... 362,360 258,278 155,848
Premium Subscriptions .................... 306,511 190,449 105,456
Total ................................ $1,528,545 $972,309 $522,189
Year Ended December 31,
2013 2012 2011
Revenue by geographic region:
United States ........................... $ 942,122 $619,485 $353,834
Other Americas(1) ....................... 109,672 66,099 28,800
Total Americas ........................ 1,051,794 685,584 382,634
EMEA(2) ............................. 358,244 217,342 109,995
APAC(3) .............................. 118,507 69,383 29,560
Total ................................ $1,528,545 $972,309 $522,189
(1) Canada, Latin America and South America
(2) Europe, the Middle East and Africa (‘‘EMEA’’)
(3) Asia-Pacific (‘‘APAC’’)
No individual customer accounted for 10% or more of consolidated net revenue or accounts
receivable for any of the periods presented.
Long-Lived Assets
December 31,
2013 2012 2011
United States .............................. $328,384 $172,278 $105,336
Other Americas ............................ 3,836 1,071 807
Total Americas ........................... 332,220 173,349 106,143
EMEA................................... 13,918 6,714 5,090
APAC ................................... 15,603 6,614 3,617
Total .................................. $361,741 $186,677 $114,850
104