LinkedIn 2013 Annual Report Download - page 66
Download and view the complete annual report
Please find page 66 of the 2013 LinkedIn annual report below. You can navigate through the pages in the report by either clicking on the pages listed below, or by using the keyword search tool below to find specific information within the annual report.-
 1
1 -
2
-
3
-
4
-
5
-
6
-
7
-
8
-
9
-
10
-
11
-
12
-
13
-
14
-
15
-
16
-
17
-
18
-
19
-
20
-
21
-
22
-
23
-
24
-
25
-
26
-
27
-
28
-
29
-
30
-
31
-
32
-
33
-
34
-
35
-
36
-
37
-
38
-
39
-
40
-
41
-
42
-
43
-
44
-
45
-
46
-
47
-
48
-
49
-
50
-
51
-
52
-
53
-
54
-
55
-
 56
56 -
 57
57 -
 58
58 -
 59
59 -
 60
60 -
 61
61 -
 62
62 -
 63
63 -
 64
64 -
 65
65 -
 66
66 -
 67
67 -
 68
68 -
 69
69 -
 70
70 -
 71
71 -
 72
72 -
 73
73 -
 74
74 -
 75
75 -
 76
76 -
77
-
78
-
79
-
80
-
81
-
82
-
83
-
84
-
85
-
86
-
87
-
88
-
89
-
90
-
91
-
92
-
93
-
94
-
95
-
96
-
97
-
98
-
99
-
100
-
101
-
102
-
103
-
104
-
105
-
106
-
107
-
108
-
109
-
110
-
111
-
112
-
113
-
114
-
115
-
116
 |
 |

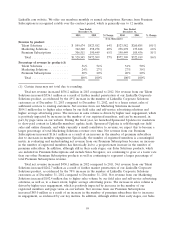
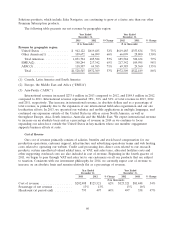
further information, see Note 12, Income Taxes, of the Notes to the Consolidated Financial Statements
under Item 8 for further information.
Year Ended Year Ended
December 31, December 31,
2013 2012 % Change 2012 2011 % Change
($ in thousands)
Provision for income taxes ............. $22,459 $35,504 (37)% $35,504 $11,030 222%
Income tax expense decreased $13.0 million in 2013 compared to 2012. The effective tax rates as of
December 31, 2013 and December 31, 2012 were 46% and 62%, respectively. The decrease in
year-over-year effective tax rates was primarily due to the benefit from the 2012 and 2013 Federal
Research and Experimentation credit offset by increased non-deductible acquisition related expenses and
increased foreign losses for which deferred tax assets have not been recognized. The increase in foreign
losses is due primarily to research and development expenses which grew internationally at a rate which
was higher than the growth rate of international revenues. International research and development
expenses include costs charged by LinkedIn Corporation pursuant to U.S. Treasury Regulations and
guidelines from the Organisation for Economic Co-operation and Development (‘‘OECD’’).
Income tax expense increased by $24.5 million in 2012 compared to 2011. The increase in income tax
expense reflects the increase in income before taxes, non-deductible stock-based compensation expense,
development costs funded by our international subsidiaries and non-deductible acquisition-related
expenses. The effective tax rates as of December 31, 2012 and December 31, 2011 were 62% and 48%,
respectively. The increase in year-over-year effective tax rates was primarily due to increased
non-deductible acquisition related expenses, the suspension of the Federal Research and Experimentation
credit, and increased foreign losses for which deferred tax assets have not been recognized. The increase
in foreign losses is due primarily to research and development expenses which grew internationally at a
rate which was higher than the growth rate of international revenues.
On January 2, 2013, the President signed into law The American Taxpayer Relief Act of 2012 (the
‘‘2012 Act’’). Under prior law, a taxpayer was entitled to a research tax credit for qualifying amounts paid
or incurred on or before December 31, 2011. The 2012 Act extended the research credit for two years to
December 31, 2013. The extension of the research credit was retroactive and includes amounts paid or
incurred after December 31, 2011. As a result of the retroactive extension, we recognized a tax benefit of
$15.5 million in the twelve months ended December 31, 2013 for qualifying amounts incurred in 2012. The
federal research credit has not been extended to new research activities incurred after December 31, 2013.
We will therefore not have a similar favorable impact to our effective tax rate in 2014 unless new
legislation is passed which will provide a credit for qualifying amounts generated in 2014.
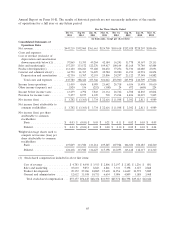
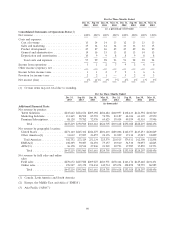
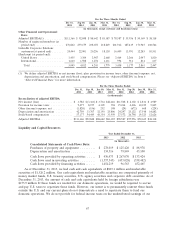
Quarterly Results of Operations Data
The following tables set forth our unaudited quarterly consolidated statements of operations data and
our unaudited statements of operations data as a percentage of net revenue for each of the eight quarters
ended December 31, 2013. We have prepared the quarterly data on a consistent basis with the audited
consolidated financial statements included in this Annual Report on Form 10-K. In the opinion of
management, the financial information reflects all necessary adjustments, consisting only of normal
recurring adjustments, necessary for a fair presentation of this data. This information should be read in
conjunction with the audited consolidated financial statements and related notes included in Item 8 of this
64