LinkedIn 2013 Annual Report Download - page 94
Download and view the complete annual report
Please find page 94 of the 2013 LinkedIn annual report below. You can navigate through the pages in the report by either clicking on the pages listed below, or by using the keyword search tool below to find specific information within the annual report.-
 1
1 -
2
-
3
-
4
-
5
-
6
-
7
-
8
-
9
-
10
-
11
-
12
-
13
-
14
-
15
-
16
-
17
-
18
-
19
-
20
-
21
-
22
-
23
-
24
-
25
-
26
-
27
-
28
-
29
-
30
-
31
-
32
-
33
-
34
-
35
-
36
-
37
-
38
-
39
-
40
-
41
-
42
-
43
-
44
-
45
-
46
-
47
-
48
-
49
-
50
-
51
-
52
-
53
-
54
-
55
-
56
-
57
-
58
-
59
-
60
-
61
-
62
-
63
-
64
-
65
-
66
-
67
-
68
-
69
-
70
-
71
-
72
-
73
-
74
-
75
-
76
-
77
-
78
-
79
-
80
-
81
-
82
-
83
-
 84
84 -
 85
85 -
 86
86 -
 87
87 -
 88
88 -
 89
89 -
 90
90 -
 91
91 -
 92
92 -
 93
93 -
 94
94 -
 95
95 -
 96
96 -
 97
97 -
 98
98 -
 99
99 -
 100
100 -
 101
101 -
 102
102 -
 103
103 -
 104
104 -
105
-
106
-
107
-
108
-
109
-
110
-
111
-
112
-
113
-
114
-
115
-
116
 |
 |

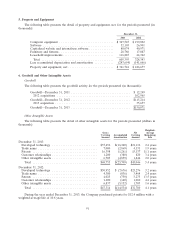
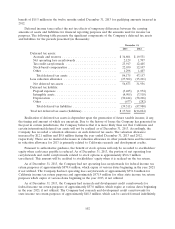
Amortization expense for the years ended December 31, 2013, 2012 and 2011 was $16.4 million,
$9.9 million and $3.6 million, respectively. Estimated future amortization of purchased intangible assets
for future periods is as follows (in thousands):
Years Ending December 31,
2014 ...................................................... $14,938
2015 ...................................................... 12,031
2016 ...................................................... 4,924
2017 ...................................................... 1,601
2018 ...................................................... 1,501
Thereafter ................................................. 7,635
Total .................................................... $42,630
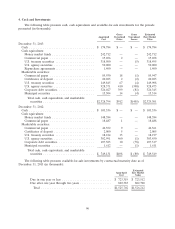
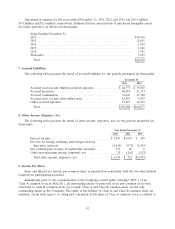
7. Accrued Liabilities
The following table presents the detail of accrued liabilities for the periods presented (in thousands):
December 31,
2013 2012
Accrued vacation and employee-related expenses ............ $ 64,757 $ 35,803
Accrued incentives .................................. 60,081 31,174
Accrued commissions ................................ 32,218 15,380
Accrued sales tax and value-added taxes ................... 10,851 9,103
Other accrued expenses ............................... 15,097 12,617
Total ........................................... $183,004 $104,077
8. Other Income (Expense), Net
The following table presents the detail of other income (expense), net, for the periods presented (in
thousands):
Year Ended December 31,
2013 2012 2011
Interest income ................................ $2,895 $1,025 $ 169
Net loss on foreign exchange and foreign currency
derivative contracts ............................ (1,626) (672) (2,965)
Net realized gain on sales of marketable securities ....... 127 60 6
Other non-operating income (expense), net ............ 20 (161) (113)
Total other income (expense), net ................. $1,416 $ 252 $(2,903)
9. Income Per Share
Basic and diluted net income per common share is presented in conformity with the two-class method
required for participating securities.
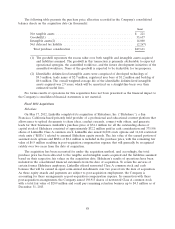
Immediately prior to the consummation of the Company’s initial public offering (‘‘IPO’’) of its
Class A common stock in May 2011, all outstanding shares of preferred stock and common stock were
converted to Class B common stock. As a result, Class A and Class B common stock are the only
outstanding equity in the Company. The rights of the holders of Class A and Class B common stock are
identical, except with respect to voting and conversion. Each share of Class A common stock is entitled to
92